 The foreign direct investment (FDI) balance in the Romanian economy reached EUR 70,113 million last year, equivalent to slightly more than 41% of the annual GDP.
Centralized data, published by the National Bank of Romania show that 70% of this amount (EUR 48,964 million) represented the contribution to the own capital of foreign companies (including reinvested profits). The remaining 30% was the net credit they received from outside the country (EUR 21,149 million).
The net FDI flow in 2016 was EUR 4,517 million, equity investments were EUR 3,203 million and the reinvested profits (technically assimilated to a foreign investment) EUR 1,138 million.
It is noteworthy the relatively high amount of losses reported by part of the FDI companies in relation to the profits declared by the other part of the FDI companies (EUR 3,123 million compared to EUR 7,410 million, of which, after the distribution of dividends amounted to EUR 3,149 million, the reinvested amount resulted, according to the BPM6 international methodology).
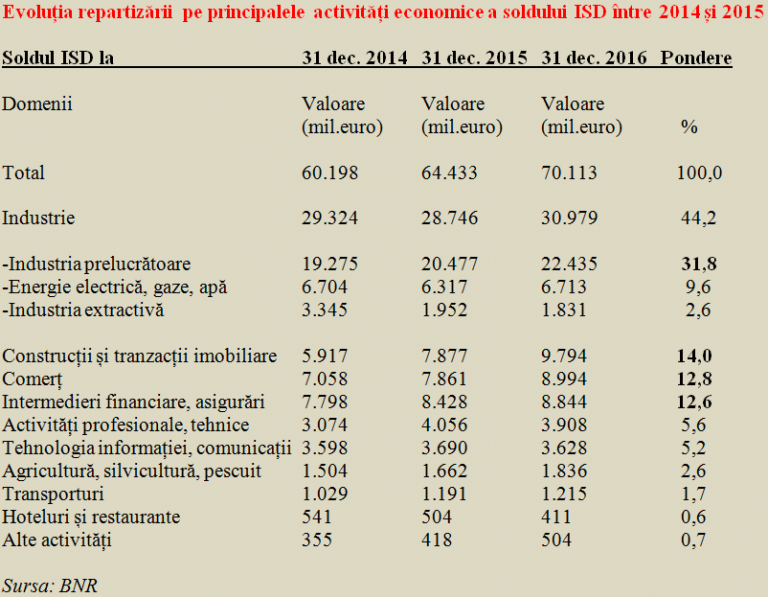
A positive fact, which should be emphasised, to an FDI increase in all fields of activity by about four and a half billion euros, new investments in the manufacturing industry exceeded the threshold of EUR 2 billion. They were followed, at a great distance, by the financial intermediation (EUR 800 million) and trade (EUR 609 million).
Within the manufacturing sector, the segments that benefited from the highest external financing were the transportation (EUR 928 million), crude oil processing, chemicals, rubber and plastics (EUR 352 million) and metallurgy (EUR 242 million).
It is noteworthy, though, that the manufacturing industry ranked below trade by the reinvested profits (EUR 650 million versus EUR 669 million).
*
- Evolution of FDI balance distribution by main economic activities between 2014 and 2015
- FDI balance Dec 31, 2014 Dec 31, 2015 Dec 31, 2016 Share
- Fields Value (million euro)
- Total
- Industry
- – manufacturing industry
- – electricity, gas, water
- – extractive industry
- Construction and real estate
- Trade
- Financial intermediation and insurance
- Professional and technical activities
- IT & C
- Agriculture, fish farming, forestry
- Transportation
- Hotels and restaurants
- Other activities
*
It is noteworthy in terms of consolidated evolution in the last two years, the construction and real estate sector outpaced the trade field, despite its robust and much more visible growth. Also, professional and technical activities were (again) significantly above information technology and communications, in the context of a limitation of the latter.
Contrary to the public rhetoric and the idea that we have a country with a remarkable tourist potential, the statistical data does not confirm that from the foreign investors’ perspective, as the share of this the sector is ridiculous and the amounts invested decrease for the second consecutive year.
How productive activity of FDI companies evolved
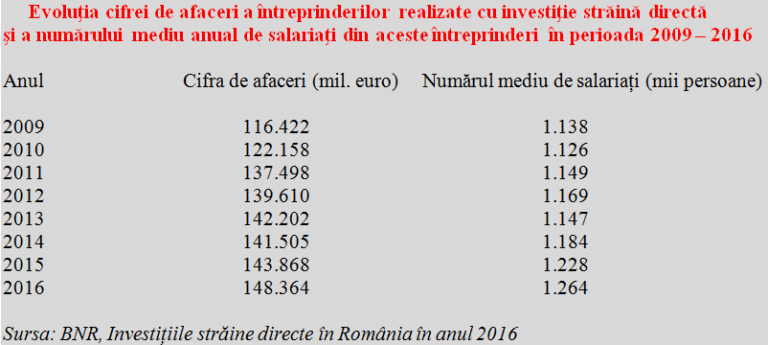
The productive activity of the foreign-owned companies increased throughout the period 2009 – 2016, except for a slight decrease of the turnover in 2014 and a temporary decrease in the number of employees in 2010 (see table). Noteworthy, 2016 saw the largest increase in the turnover of FDI companies over the last five years but the increase in the number of employees has slowed down.
*
- Evolution of turnover and annual average number of employees of FDI enterprises between 2009-2016
- Year Turnover (million euro) average number of employees (thousand people)
*
In total, the net revenues of foreign direct investors in Romania amounted last year to EUR 5.069 billion.
They resulted from net profits of EUR 4,287 million and net interest income on loans granted by parent companies to their subsidiaries in Romania amounting to EUR 782 million (15% of the total). To position ourselves in relation to the size of the economy, we mention that, all in all, net revenues from foreign investments made in Romania accounted for exactly 3% of GDP in 2016.
Finally, it should also be mentioned the importance of these FDIs in terms of foreign trade, where they made 74% of exports and 66.3% of imports (even more but also balanced, 82.1% of exports and 82% of imports in the manufacturing sector). The highest levels were reached in the machinery and equipment segment (92.0% and 90.9%, respectively) which is categorically dominated by foreign capital.


