 Romania recorded an annual inflation of 2.6% at the end of 2017, according to the data provided by Eurostat for all member states. We are therefore ranked fourth in terms of price increases, at a high distance from Lithuania (3.8%), Estonia (3.8%), behind the UK (3.0%) and slightly above the group that includes Austria (2.3%), Hungary, Latvia and the Czech Republic (all of them with 2.2%).
However, if we make the comparison with the best performances in the EU, namely 0.5% in Ireland and Finland and 0.8% in Denmark, which give an average of only 0.6%, it results that we reach a two-percent spread. That is, we no longer meet one of the five most important indicators set at Maastricht for adopting the euro – inflation, which required a difference of maximum 1.5%.
Being in a slight decline after they constantly advanced during the year, inflation level in the Eurozone and the EU average ended the last year at 1.4% and 1.7%, respectively, below the theoretically desirable 2% per year. Germany (1.6%) led the platoon of Romania’s major trading partner economies, while Italy (1.0%) and France (1.2%) slowed down the average growth for prices in euro.
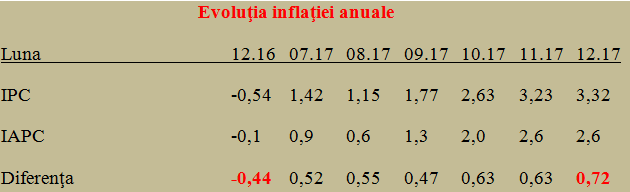
INS had recently announced the value of 3.32% for inflation in Romania, as measured by the IPC consumer price index. The level of 2.6% reported by Eurostat is abbreviated HICP, where H comes from „harmonized” and the classification includes 12 categories of goods and products (not just three, with the energy, for example, being included in non-food products in our case).
Moreover, while in other years differences were small and gaps were relatively constant and with the same sign between the two indices measuring the average price variation, 2017 brought both an expansion of the gap to more than 20% of the officially communicated value as well as a change in this sign. 12 months ago, HICP appeared to be higher than CPI and now it is the opposite (see table).
*
- Annual inflation evolution
- Year
- CPI
- HICP
- change
*
To make matters even more complicated, the target set by the National Bank, with a one percentage point variation, is not 2% (Eurozone benchmark), but 2.5%, namely adapted to the national specificity and the inevitable (slow) convergence of prices, which takes place at the EU level, under the conditions of the single market.
That is why we found helpful, in order to not give up to the alarming news spread in search of an audience or for a political interest (in both meanings, good and bad) to give you some explanations so that you can judge on a solid basis, how price increases affect your living standard? An important remark: even before joining the EU, Romania aligned itself to the European practices in measuring the evolution of prices, which has been certified by Eurostat.
- The most important factor having impact on the international comparability of the CPI is the way of handling the costs of owner-occupied dwellings (or, Romania is the European country with the largest share of owners, with 96.5%; for reference, Germany is at the other end of the scale, with only 51.8%, according to the latest data released by Eurostat).
In 16 of the 27 EU member states (including Romania), these costs are excluded from the CPI calculation according to the national definition, while in other member states they are approximated either by rents applied to owners or expenses related to mortgage loans. In the second case, as a rule, the variations in the expenses for major repairs/space improvements are included, or, alternatively, the variations in the estimated depreciation of the dwelling are included. HICP does not include the changes in the costs related to owner-occupied dwellings.
- In consumer spending, on the „national” principle of consumption, the CPI reflects the price variations of all goods and services purchased by resident consumers in that country, including their expenses abroad. That is why it cannot be used for comparisons between countries but is useful in establishing national economic policies.
The alternative to the „internal” principle considers all consumption expenses in that country, irrespective of the resident/non-resident status of the consumer. HICP is calculated on the „internal” principle of consumption (which allows international comparisons). If you want to simplify, CPI measures the inflation for Romanians, while the HICP calculation reflects the inflation in Romania.
- Updating the composition and structure of the consumer basket used in the CPI calculation according to the national definition and the HICP can be done at different periods of time. An advantage of the periodical update of the basket and the weights, every year, is that the index reflects current consumption trends.
The problem is that the CPI calculation for the year T uses the currently measured prices but the weights in the consumer basket found in the T-2 year. Or, during a two-year interval, especially if there are, important tax changes can disrupt the data comparability.
The best example is the generalization of the reduced VAT rate of 9% applied to food products (moreover, applied not at beginning of the year, but as of June 1, 2015, data used in the calculation of the inflation as of June 2017 onwards, namely since the inflationary trend emerged).
In this context, for 2018, when we use the weights from 2016, we can expect significant changes of weights in the consumer basket.
- There are also three other technical issues at the level of aggregation, the scope of health services, education and social protection, or the statistical approach to changing the product quality (leading to so-called connection indices, very controversial for products that evolve very fast, such as electronic products), adding new products to the consumer basket, sales acts, seasonal products.
All in all, to find out where the extra money goes and where we can intervene in the family budget to fall within the possibilities that the income provides and the obligations such as instalments, invoices, etc., it would be useful to be a bit more careful about the statistics. They are useful to some extent since they are obtained with so much calculation and headache.
A clue in this regard, starting this year, Eurostat will publish once the price index in the Eurozone (obviously, of the HICP type) and a simplified picture of the contributions to the general price increase in four large groups of goods and products: food products, alcoholic beverages and tobacco, energy, non-food products and services, where the sum should be 100%. Perhaps it would be useful to do something similar at the national level of the CPI.