 BNR made a thorough analysis of Romania’s status in terms of real convergence with Western economies. A precondition for adopting the euro, in line with the treaty signed at the moment of the EU accession. Here are the main conclusions regarding the evolution of the employees’ purchasing power.
Over the past 17 years, the convergence in terms of GDP per capita in Romania (PPS, meaning at the local parity of the standard purchasing power, which considers the price level to ensure fair comparability between countries) has accumulated 33 percentage points (from 26% of the EU average in 2000 to 59% of the EU average in 2016), the second highest among the former socialist states, after Lithuania (+38 pp)
The ratio between the gross national wage, which represents the value added by Romanians in the country and abroad, and the GDP, which expresses the gross added value obtained in the country by Romanians and foreigners, decreased by 1.8 pp, from 99.3% in 2000 to 97.5% in 2016. An evolution similar to Lithuania (-1.7 pp) and Poland (-2.6 pp) but weaker than Hungary (+2.8 pp).
Marginal increase in number of employees and partial increase in their purchasing power
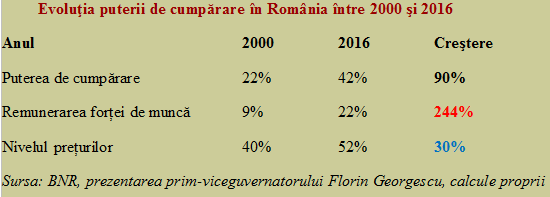
The number of employees increased between 2000 and 2016 by only 2.2% (+100 thousand people), from about 4.6 million people to 4.7 million people. In the same period, the employees’ purchasing power increased by 90% (from 22% in 2000 to 42% in 2016), compared to the additional more than 30 pp in terms of volume of activity.
*
- Evolution of the purchasing power in Romania between 2000 and 2016
- Year
- Purchasing power
- Workforce remuneration
- Price level
*
From the data presented, it results that Romanians were extremely poorly remunerated for the work done in 2000, by reference to the EU average. The approaching accession and then the fast integration into the Western production chains following the foreign investment that took over the key sectors of the economy have somehow mitigated the situation but the wage purchasing power lagged significantly behind the GDP indicator (we recall, 59% of the EU average).
Comparisons with other former communist countries
Very interesting are the developments in several countries, former colleagues of the Eastern bloc and current colleagues of the European Union.
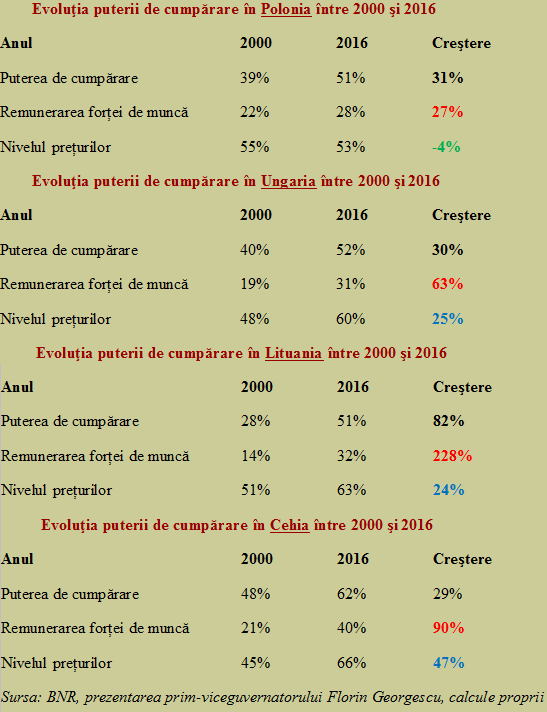
There is a fundamental difference visible between Romania and Poland, the country with the closest economy size and structure to ours. Romania recorded the highest wage growth and Poland the lowest growth, relative to the EU average.
Instead, we have witnessed the highest price increase in real terms after the Czech Republic (which has maintained a strong currency and become a kind of Switzerland of the Central Europe) and we almost reached Poland by the level of prices (from the score of 40% – 55% in 2000, we reached 51% – 52% in 2016, against the background of the price decrease in Poland relative to the EU average.
This, combined with the moderate advance in the Polish wages, explains the country’s competitiveness in the region as well as in the Western markets. The reason (which we should pay attention to!) for which Lithuania has remained below us in terms of performance in improving the standard of living in the 16-year interval mentioned is precisely the advance of prices to the level registered in the Czech Republic.
To keep in mind, the increase in the standard of living in Hungary, Poland and the Czech Republic was only one-third of that in Romania. This is the reason why we can say that our recovery since the beginning of this century was quite spectacular. Maybe we did not manage to get closer to the West as much as we wanted, but we have successfully come closer to the Central Europe.
*
- Evolution of the purchasing power in Poland/Hungary/Lithuania/the Czech Republic between 2000- 2016
- Year
- Purchasing power
- Workforce remuneration
- Price level
*
Labour productivity – still well above salary costs, relative to the EU average
It should be noted that in 2016, the labour productivity in Romania accounted for 31% of the EU average (up 4 percentage points compared to 2008 and 5 percentage points compared to 2012, after the economic adjustment), 9pp above the hourly cost a the workforce which represented 22% of the EU average (up 2 pp compared to 2008 and 5 pp compared to 2012).
Hence, the analysis reached a conclusion of a sustainable labour cost development, which, through its increases, has not eroded Romania’s economic competitiveness within the EU. That, even though the minimum national wage has increased by 81% between 2014 and 2017 (with a low reference base, but that is why we can no longer increase it at a high rhythm from now on), as well as in the other countries in the region (with higher bases): the Czech Republic (+ 29%), Hungary (+ 26%), Slovakia (+ 24%), Poland (+ 19%).
The assertion is supported by the fact that, although labour costs increased in the period 2012-2017, 700,000 new jobs have been created, especially in the real economy. The wage bill growth process did not affect the competitiveness of the economy as a whole and the employees have been redistributed between economic sectors as a result of the change in the production structure.
Finally, if we link real wages to the real GDP, as a comparability with the European countries, we can see how the ratio between the purchasing power of 42% of the EU average and the GDP of 59% of the EU average is seen, not surprising at all, at the level of the ratio between the labour cost of 22% of the EU average and the productivity of 31% of the EU average – that is, about 70%.
This is also an indicator that could tell us who uses and who benefits from the value added in the Romanian economy. Although a possible analysis should go beyond the simplistic form of how much goes to the foreign capital that has invested here and how much to the domestic capital and/or the labour force.
That is, to detail at the level of the income inequality in our country – 8.2 to 1, the ratio between the richest 20% of Romanians and the poorest 20%, about double the Czech Republic (3.5 to 1), Hungary (4.3 to 1) and Poland (4.9 to 1). Respectively, besides the convergence with others, let’s see how we converge with ourselves.