 Romania insists on staying on the penultimate position among the European Union member states in terms of R & D expenditure in 2017, according to data published by Eurostat.
With just 0.5% of GDP, slightly higher than in the previous year, we positioned ourselves next to Cyprus and took advantage of the surprising decline recorded by Latvia (0.44% of GDP in a free fall after it marked 0.63% of GDP one year ago).
Against the backdrop of budget constraints and a still relatively low involvement of the private sector, we have reached just one-sixth of the EU target set for 2020 and we have positioned ourselves below the maximum level reached in 2008 (0.55% of GDP).
Compared to the situation in 2014 (the year when we returned to the same GDP level as before the crisis), things were much better in the private sector (0.29% of GDP vs. only 0.16% of GDP) but have marginally deteriorated in the public sector (from 0.22% of GDP to 0.21% of GDP).
*
- Evolution of R&D spending as a share of GDP in Romania 2007 – 2017
- Year
- Share of GDP-RO
- Share of GDP-EU
*
If we relate the level of research allocations as a share of Romanian GDP to the EU-28 average, we can see a worsening of the situation, from about 30% in 2008 to less than 19% in 2014, followed by a return to 25% in 2017 (we still do not have data for the EU average, but we can see they have remained almost constant in recent years).
In fact, it has become quite obvious that the R & D sector cannot keep pace with the economic growth and the European practice, which maintains us in the situation of a market for the products made by others and a (still) cheaper workforce for the industrialization of products designed and having a high added value earned by others.
All in all, the data position us totally outside the targets set by the Europe 2020 strategy. There is no way to grow with Europe toward the target of 3% of GDP, or at least to maintain ourselves close to countries from the former Eastern bloc such as the Czech Republic (1.68% of GDP), Hungary (1.21% of GDP), Poland (0.97% of GDP) or even Bulgaria (0.78% of GDP) – data valid for 2016.
It is a weak point of a major importance in the economic strategy, capable of compromising our chances to move towards a production with a pronounced innovation factor and a higher added value.
That explains to a large extent our competitiveness deficit and does not allow us to successfully cope with the external competition. Including from products coming from the former Eastern bloc countries, which compete with us in Western markets and generate a growing deficit in our foreign trade balance.
It is worth noting that Bulgaria, which started from a lower level than us at the moment of the EU accession (0.43% of GDP versus 0.51% of GDP), has surpassed us and left us far behind, even though it decreased the rhythm from 0.96% in 2015 to just 0.78% in 2016, which shows that progress must also be consolidated and confirmed in time. Also, the country with the largest increase in research and development spending in the first ten years after joining the EU, Slovakia, was also the first in its accession wave that joined the Eurozone in 2009. However, it speeded down from 1.18% in 2015 to 0.79% in 2016.
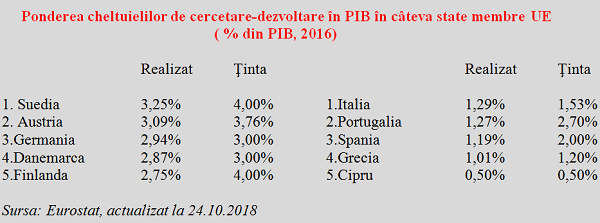
For reference, it would also be useful to make a comparison between the Nordic countries from the top of R&D allocations and the older EU member states from the southern continent. This comparison gives us the image of the capacity to generate a sustainable growth in living standards and the importance of knowledge in developing new technologies. In a nutshell, we see the demonstration that competitiveness issues start at the origin of production processes.
*
- R&D spending share of GDP in some EU member states (% of GDP, 2016)
- Achieved Target Achieved Target
- Sweden Italy
- Austria Portugal
- Germany Spain
- Denmark Greece
- Finland Cyprus
*
Structure of amounts spent
In 2017, only RON 4.3 billion was spent on research and development in Romania. Unfortunately, out of this amount, almost 91% represented current expenses and only 9% capital expenditures (proportions were 82% and 18% five years ago). Looking at the structure, the amounts spent on equipment and appliances amounted to 61.8% of total capital expenditure (77.5% five years ago).
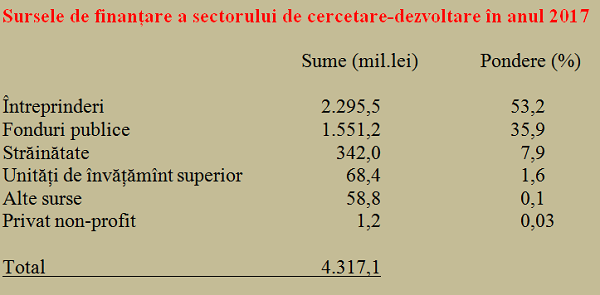
Regarding the structure of the amounts allocated for research and development at the national level, more than half came from public funding, almost 36% from enterprises (down from about 40% in the previous year) and somewhere around 8% came from abroad. To keep in mind, less than two percentage points of the total money allocated went to the higher education sector, in the context of a weak correlation between the education received in faculties and the real needs of production processes.
*
- Sources of financing for R&D sector in 2017
- Enterprises
- Public funding
- From abroad
- Higher education institutions
- Other sources
- Non-profit private
*
All in all, officially announced data tell us that we should allocate from public funds (from where, given the current budget revenues collected, as a share of GDP?) much more to the development of the R&D sector and grant much more substantial facilities to the private sector for the development of R&D firms.
For the time being, the allocation of very low amounts to developing high value-added products is a major shortcoming, including for the much-wanted convergence with the development level of the West. It will have an impact on the pace of economic development as local price and cost advantages are going to end and will send us, in the medium and long term, into the so-called middle-income trap, which will keep us at a significant distance compared to the European average.


