 The trade deficit for the first quarter of 2017 was EUR 2.32 billion, 18% higher than in the same period of the previous year, according to the INS data.
Exports grew at a very good pace (+ 11.5% to EUR 15.46 billion), but they have been outpaced by imports, which rose by 12.4% to EUR 17.78 billion.
The imports coverage ratio by exports decreased since the beginning of this year to 90.7% but remains above the values registered for 2015 and 2016.
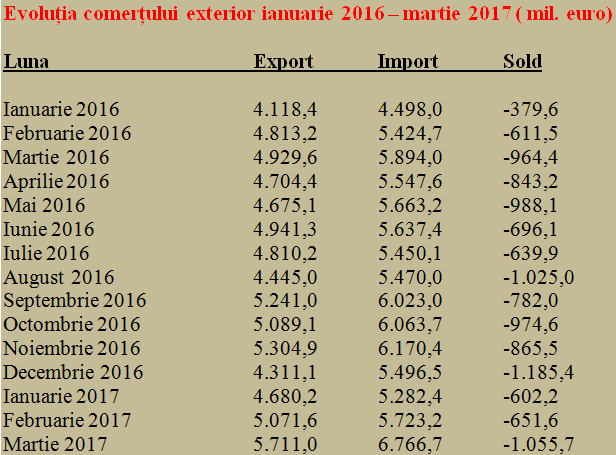
Unfortunately, the monthly foreign trade deficit increased again in March over the EUR 1 billion threshold, attained only in two of the last 15 months.
*
- Evolution of the imports coverage ratio by exports between 2009 – 2017
- Year
- Coverage ratio FOB/FOB
- * after three months
*
State of play of the foreign trade evolution between January 2016 and February 2017 is as follows:
*
- Evolution of foreign trade between January 2016 – March 2017 (million euro)
*
Trade exchanges with the EU countries amounted to EUR 11.76 billion in exports (with a share of 76.1% of total exports) and EUR 13.51 billion in imports (76.0% of total imports, increasing share compared to the previous month). In the extra-community trade, there have been registered exports of EUR 3.70 billion (23.9% of total exports) and imports of EUR 4.27 billion (24.0% of total imports).
*
- Structure of foreign trade in the first three months of 2017 (million euro)
- Export Import Surprlus/Deficit Share of deficit
- Intra-EUR28 trade
- Extra- EUR28 trade
*
Worth being taken into account as an important evolution in the structure of Romania’s foreign trade deficit, the share of the intra-EU trade in the total deficit dropped from about 90% last year to only 75% in the first three months of 2017, while the deficit rate increased on the extra-community trade segment, from about 10% last year to 25% in the first quarter of this year.
What the balance of foreign trade looks like in terms of structure
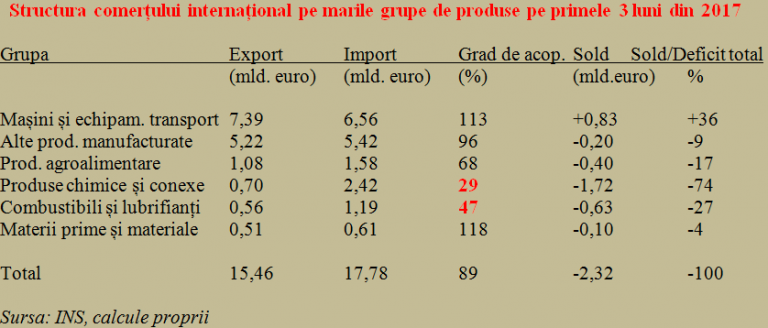
In terms of structure, Romania achieved a positive sectoral result only on the machinery and transport equipment segment (+EUR 0.83 billion), where the imports coverage ratio by exports was 113%. This figure is declining though since the beginning of this year, as did the share of this sectoral surplus in the total deficit (from 48% at the end of the previous month to only 36% in the first quarter).
The imports coverage rate was also declining slightly in the segment of other manufactured products (from 98% to 96%), where the deficit was about EUR 200 million. That is half the level of the food products segment, where the imports coverage rate by exports dropped quite sharply to only 68% after having reached 100% two or three years ago.
Data provided by INS show that the whole Romania’s trade deficit can be attributed to the chemicals and fuel sectors, which accounted for 101% of the total, due to very poor performance of the chemical industry (coverage rate of only 29%) and surprisingly poor performance on the fuel segment (coverage rate of 47%).
*
- Structure of foreign trade by main product categories in Q1 2017
- Group Export Import Coverage rate Balance Sold/total deficit
- Machinery and transport equipment
- Other manufactured products
- Food products
- Chemicals and related products
- Fuels and lubricants
- Raw materials
*
The deficit on the segment of raw materials is less significant and it would not even be a problem if we imported more raw materials than exported, to obtain more added value by using them in the country.
Last, but not least, it should be emphasized that the slight devaluation of the national currency against the euro did not help reduce the trade deficit by increasing price competitiveness. The average exchange rate in the first quarter of 2017 was 4.52 lei/euro compared to 4.49 lei/euro in the first quarter of 2016, but the result was an increase of more than one-sixth of the trade deficit.


