 While the government programs of parties competing for the Parliament focus on tax cuts, after 2 years of tax cuts, policies for internal convergence are lacking.
The state’s intervention to stimulate development, replaced with the politics for election – limited to creating a budget mechanism – missed or was incoherent:
so, despite the preparations being made for the Union Centenary, the century passed since that moment will find not only an economically and socially fragmented Romania, but also one where divergences are widening.
We publish below 3 maps from the perspective of this hundred years: Transylvania will abound with motorways, while the „Kingdom” will almost be left with what already has now and there will not be motorways or high-speed roads cut through the Carpathians;
the GDP per capita gap between the historical regions will be higher;
foreign investment – attracted in a drastic imbalance – will continue to go from now on to the regions where there is transport infrastructure.
Each of these maps is accompanied by observations that should give decision makers food for thought – from the Cotroceni Palace to the electoral constituencies that are literally cut off the world.
True, there are countries in Europe where internal discrepancy is higher: Romania has though a specificity related to its geographical position which makes it more vulnerable – topic that we will approach below.
1 – Transportation infrastructure
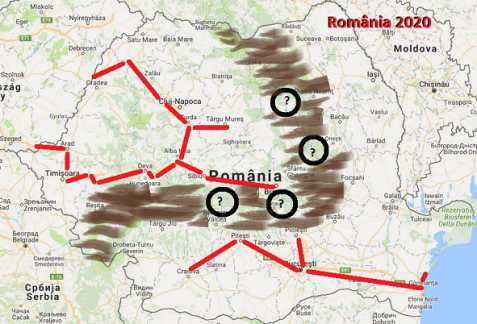
(Click to enlarge)
The data come from the timetable of works’ completion for the highways, from the Ministry of Transportation.
In 2020, Transylvania will be completely connected to the West by two highway routes – one north and one in the Banat – while the southern region will only be enriched by the Pitesti-Craiova route. Moldova – Romania and Europe’s eastern border will be as disconnected from Europe as today.
There will be no highway crossing point through Carpathians, even at that time.
The development is made along the infrastructure – as seen in the following two maps.
2 – Foreign investment:
When Daimler announced for an investment that needs for the products made in Eastern Europe to reach the factory in Bremen in 17 hours, we could understand why the FDI map looks like the one below.
Foreign investment balance (FDI) at the end of 2008 and 2015
The data represent the foreign direct investment balances in 2008 and 2015 – with their evolution.
Transylvania is twice the average. We have excepted Bucharest-Ilfov area from calculations, as irrelevant: big companies account their investments and income here statistically – Bucharest-Ilfov meets even today the criteria for accession the Eurozone and in terms of living standards related to purchasing power and prices above many European capitals.
Banat drew in 7 years 5 times more investments than the Northeast region. The regions blocked on this side of the Carpathians are also doing badly.
-
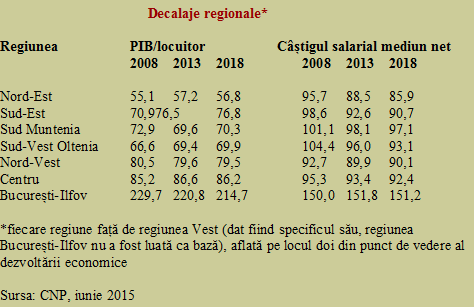
GDP per capita: Transylvania – 150% compared to Moldova. But there are more relevant observations:
GDP per capita in 2008 and forecast for 2018
Comments and tearing myths down:
3A. It is an important issue in terms of certain political approach aimed at the country’s cohesion and integrity, starting from the economic flows that would result from the heterogeneous levels of territorial development.
The results based on the official statistics do NOT confirm a series of clichés quite extensively circulated. They confirm the reversal of the process of bringing the economic performances closer, followed closely during the years of planned economy, but not a corresponding increase of the living standards resulting from widening these gaps.
*
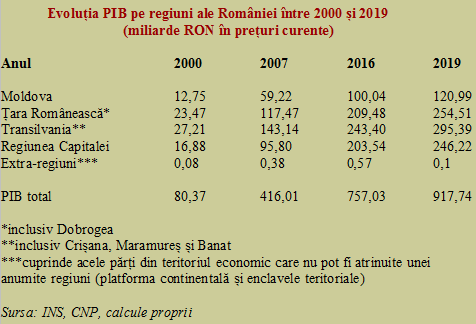
- GDP evolution by Romania’s regions between 2009 and 2019 (billion lei, in current prices)
- Year
- Moldova
- Wallachia
- Transylvania
- Capital area
- Extra-regions
- Total GDP
- * including Dobrogea
- ** including Crisana, Maramures and Banat
- *** comprises those parts of the economic territory that cannot be assigned to a certain region (continental shelf and territorial enclaves)
- Source: National Statistics Institute, National Commission of Prognosis, own calculations)
*
3B. The most popular thesis about Transylvania’s money that would sustain yet from a historical perspective the regions of the Little Kingdom simply does NOT stand a fair assessment: even if we consider the Centre Region and Moldova, for example, the GDP / capita – foreign investment relationship, with all that these investment entails (3 times bigger! in the Centre Region than Moldova, as shown in the 2nd map above), or judge the salary levels relative to GDP / capita.
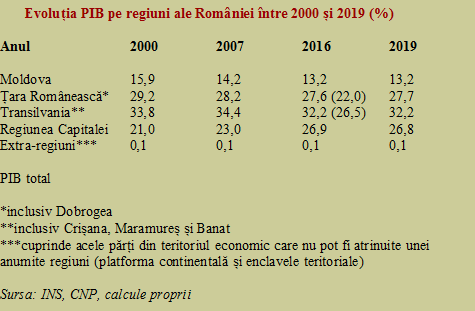
The fact is this: Moldova’s participation in GDP will decrease to 13.2% in 2019, from 16% in 2000.
For the biggest problem is undoubtedly the contrast between the continuously growing population of our Moldova’s territory and the equally decreasing contribution of this country’s region as share of GDP (see table).
- *
Evolution of GDP by regions of Romania between 2000 and 2019 (%) - Year
- Moldova
- Wallachia
- Transylvania
- Capital area
- Extra-regions
- Total GDP
- * including Dobrogea
- ** including Crisana, Maramures and Banat
- *** comprises those parts of the economic territory that cannot be assigned to a certain region (continental shelf and territorial enclaves)
- Source: National Statistics Institute, National Commission of Prognosis, own calculations)
*
Neither in the near future a solution for the situation in the Eastern part of the country is foreseen, a region that seems to be doomed to remain the poorest in the absence of major infrastructure works to connect it to the West that is easier to be reached by large private investment – as the most feasible way forward: the Romanian state has withdrawn from the economy and can no longer practice more favourable tax regimes in certain areas of the country.
3C. Some anti-mythology – Moldova-Centre-Banat: GDP per capita and salaries
- *
Regional gaps* - Region GDP/capita Average net salary
- North-East
- South-East
- South Wallachia
- South-West Oltenia
- North-West
- Centre
- Bucharest-Ilfov
- * each region compared to the West Region (given its specificity, Bucharest-Ilfov Region was not taken into account as basis) that ranks 2nd in terms of economic development
- Source: National Commission of Prognosis, June 2015
*
In terms of salary, if make a connection between the macro indicators and daily life, earnings could be compared with the GDP / capita levels. Then we could say that, compared to Banat’s situation (where we assume that wages are fairly calculated based on the results of the economy), salaries in Moldova are by about 50% higher than they should be, and by 30% lower in the capital city.
The explanation for Moldova region from the right side of Prut river is that it belongs to Romania, while the situation of the Republic of Moldova, on the left side of the same river, is about three times worst in terms of earning levels, simply because it is separated from Romania. We recall that the state is market-maker on national labour market and the salaries of the public sector’s employees should be the same in Timisoara as in Vaslui.
Only now it comes the most interesting part for the Transylvanians from the Centre Region, who are concerned about where their money is going. With a GDP of about 83% of the Banat’s GDP, they enjoy salaries equal to about 92% of those from Banat, based on the same natural principle of solidarity and national cohesion; meaning that they also receive, indirectly, a bonus of about 10% for their membership to Romania.
3D. Equally big problems: Gaps between neighbouring counties
More correct would be, though, to note that important investment flows are not between historical regions but within the regions of development that bring together strong and less developed adjacent counties.
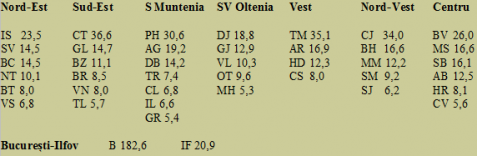
Summarizing, the GDP situation by counties, in billion lei and using the abbreviations from the license plates, according to the estimates of the National Commission of Prognosis for 2016 shows as follows:
*
- North-East South-East South Wallachia South-West Oltenia West North-West Centre
- Bucharest-Ilfov
*
The GDP problem is not the historic GDP defined by regions, but the fact that, for instance, Iasi makes about as much as Vaslui, Botosani and Neamt altogether; or Constanta is nearly equivalent to Tulcea, Braila, Galati and Buzau altogether.
In Transylvania, Cluj has a similar GDP to the cumulated GDP of Salaj (which appears below Tulcea in the statistics!), Bistrita-Nasaud (a kind of Calarasi), Satu-Mare (just slightly above Botosani) and Maramures (below Gorj in terms of economic strength).
Brasov also comes to confirm the rule, its results being nearly equal to that of Alba Harghita and Covasna mixed trio, with the majority Alba makes as much as the two minority counties combined. Coincidentally, the Romanian-Hungarian Mures county makes about as much as Sibiu. Of course, for the formula to be complete, the rule is also confirmed by Timis, equal to Hunedoara + Arad + Caras-Severin.
4 – Problem: internal divergence and political approach. National cohesion and integrity
Romania is not the state with the largest internal divergence in Europe. Its disadvantage though is that, being at the most complicated EU border, the financial and human resources flows to one way or the other can compromise and disconnect the region located on this side of Carpathians from the region located on the other side, first economically and socially, given that every passing year deepens the gaps.
Added to that are the phenomena happening in a short time that may compromise the measures to be taken when it is too late: an example would be the flow of labour force, an asset of which the presumptive investors from the next 10-15 years, when a highway will be built, will be deprived.
Finally, the phenomenon of economic centrifugation cannot be ignored, all the more so since no improvement of the situation is foreseen in the South or the West regions and especially in the Northeast region, in the next five-year interval.
We presented the maps and tables above against the background of the last decade, taking a look towards 2018-2020 in order to highlight the trend: in the next 2 years when we shall be celebrating 100 years since the Great Union, things will look even worse.
Is there anything to be done in these two years? That is what our politicians involved in the campaign should answer, who should take out from their programs the decrease of the state revenues that could be used for infrastructure and training the workforce, and consider measures for balancing much more than the economy. At least in the speeches to be delivered in the next days, anything other than just „Happy National Day, Romania!”.