 Romania ranks the last among the EU member states in terms of share of state employees in total workforce, according to data published by Eurostat in 2015. This situation exists even though we are the state that registered the highest increase in the percentage of public sector workers over the last twenty years, from 6.1% in 1995 to 11.6% last year.
We are also the only country in the EU where the main economic sector, in terms of number of people involved, is agriculture, accounting for 26.6% of the total people employed. This time inversely, though we registered the steepest decline of this indicator over the last 20 years, which reached a level of 42.4% in 1995.
These data show that we started on the road toward the westernization of the economy with serious structural disadvantages and have failed to this day to catch up not only the members of the old EU15, but even the former colleagues from the Eastern bloc integrated into the EU, including Bulgaria which has a good percentage advance in front of us in terms of state employees.
Noteworthy is also the penalizing paradox for the current productivity of the social labour to total economy of a current relative productivity in agriculture of only 40% of the level from 1995. Specifically, 42.4% of the employed population produced 19.2% of gross value added included in GDP. Now, the remaining 26.6% produce only a quarter of the contribution from two decades ago, namely 4.8%.
Basically, we have a country strongly divided between an industry more developed and powerful than we think (not that there is no room for improvement) and an agricultural sector closer to the nineteenth than the twenty-first century, which offers poor social services to everyone, by virtue of average resulted from this structure.
Personnel issues in Administration, Education, Health …
It could not have been otherwise, as man is the main production factor, especially in the social areas, and what matters first and foremost is quality. Here is how data look like for several European countries, to position ourselves in the EU context and stop listening to clichés like „fat man sitting in the back of weak man”:
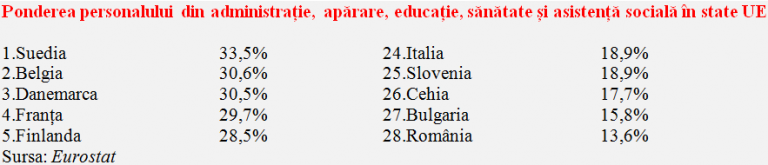
- Share of personnel from administration, defence, education, healthcare and social assistance in the EU states
- Source: Eurostat
Important to note is that all well placed states within the EU in this respect have budget revenues much higher than us as share of GDP and employ in more people the public sector than we have in the agricultural sector mentioned above. They are people whom we support directly or indirectly from the budget, instead of taking them from the field where they lack productivity and redirect them, after appropriate education, towards the budgetary sectors (where social assistance should come predominantly from them and not be directed to them).
Not for other reason, but in terms of share of state employees we are ten percent below the EU average, twenty percent below Sweden and, if you would prefer something closer to a model, at less than half of the public sector from France.
From the perspective of the overall economy, what saves us is the still fairly high percentage of the industry in the economic gross value added, where we rank the 5th (be aware and remember!), ahead of Poland and Germany. Noteworthy is that the top ten comprises former socialist states, but the European locomotive Germany and her sister Austria slips between them.
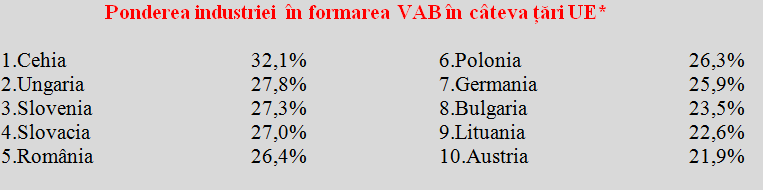
- Industry share of the gross added value in some EU countries*
- *We have left Ireland out from the ranking, a country that displayed an implausible 39.2%, because of some exceptional reporting conditions
Why this economic sector is important, inherited from the times of planned economy: the results of 26.4% of gross added value in our case are obtained with only 20.6% of the workforce, which means that this sector bears along the whole economy, by productivity and large value basis.
It is only on this basis that results such as 6.4% of gross added value obtained with 2.3% of workers in IT and communications are possible or 3.9% of gross added value with 1.3% of the workforce in the finance and insurance activities (which otherwise have seriously diminished their share in the last 20 years, as in 1995, before the big privatizations, they were representing 7.4% of the gross added value).