 The trade deficit in the second quarter of 2017 was EUR 3,520.7 million, according to the data provided by the INS, which shows a spectacular increase by about 52% compared to the first quarter of the current year.
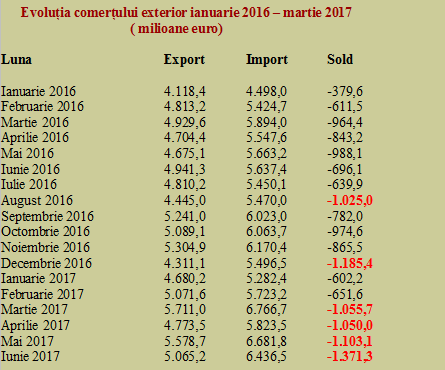
Moreover, in June, the highest monthly trade deficit has been reached, of nearly EUR 1.4 billion or almost 40% of the entire quarter.
Worryingly, while the growth rate of imports remained unchanged at the middle of the year compared to the end of the first quarter of 2017, respectively 12.4%, exports slowed down visibly and the result related to the beginning of the year declined from 11.5% to 9 6%. This shows a trend that should give food for thought to decision makers and affects the macroeconomic balances.
The coverage ratio of imports based on exports decreased from 90.7% in the first quarter to 87.7% in the first semester.
It is a notable poor performance after the good level achieved in 2014 and we are heading (much too fast) to the levels of the time when we were trying to get out of the economic crisis (see the table).

*
- The import coverage ratio between 2009-2017
- Year
- Coverage ratio FOB/FOB
- * at the end of 1st semester
*
After exceeding the EUR 1 billion level in March, the monthly trade deficit is heading for a new threshold, of EUR 1.5 billion, which is very likely to be reached following the recent wage and pension increase measures. Both with an annual increase rate of nearly 15% compared to an economic growth that will be somewhere around 5%.
At a 3 to 1 ratio of the income growth to the economic growth, it is very difficult for the domestic production to instantly connect and provide an appropriate offer.
This also explains the shift in consumption to the imported goods once the level of 1,000 euro per month in terms of wage purchasing power has been easily exceeded and the pensions have been arbitrarily increased by 9% in the middle of the year.
The state of play of the foreign trade evolution between January 2016 and February 2017 is as follows:
*
- Foreign trade evolution January 2016 – February 2017
- Month Export Import Balance
*
Situation by destinations
Trade with the EU countries amounted to EUR 23.48 billion in terms of export (with a share of 76% in total exports) and EUR 27.84 billion for imports (75.8% of total imports).
On the extra-community trade side, exports registered amounted to EUR 7.40 billion (24% of total exports) and imports EUR 8.88 billion (23.8% of total imports).

*
- Foreign trade structure in H1 2017 (mn euro)
- Export Import Surplus/Deficit Share of deficit
- Intra-EU28 trade
- Extra-EU28 trade
- Source: INS, own calculation
*
While the shares in Romania’s foreign trade structure remained relatively constant, about three-quarters in relation with the EU member states and one quarter in the non-EU segment, it should be noted a certain faster growth of the trade deficit in the second quarter in relation to the non-EU countries (almost + 60%, one quarter to another, compared to „only” 50% in relation to the EU countries).
Beware of the exchange rate
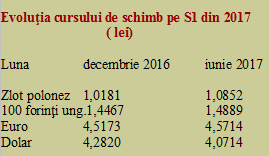
In other words, we are witnessing an increased loss of competitiveness in relation to the segment outside the EU compared to the situation not good at all in relation to our colleagues from the same economic bloc. And that in the context of a relative devaluation in relation to currencies such as the zloty or forint from the non-euro part of the EU as well as to euro. The devaluation that has not helped us against the depreciation of the US dollar, which has decreased the price of commodities contracted in this currency.
 Evolution of the exchange rate in S1 2017 (lei)
- Month December 2016 June 2017
- Zloty
- 100 forints
- Euro
- Dollar
All in all, the end-of-year situation does not look so good if we fail to quickly get out of the ever-growing trend of strengthening the trade deficit at a higher level than the one-billion-euro monthly benchmark.
To clarify its size, it should be noted in this context that Romania’s total GDP would be estimated around EUR 180 billion in 2017 and the trade deficit at the middle of the year was 3% of GDP and leads to 7% of GDP.
We recover some of it from the service sector but the rest must be financed by foreign investment if we want to maintain the exchange rate. So, with the deterioration of the trade balance, we become increasingly vulnerable to the revenues from services (beware, more than half comes from transportation!) as well as to the availability of others to invest here.