Data published by INS for the second quarter of 2018 show that Romanians’ monthly incomes have reached nearly RON 1,600 per person.
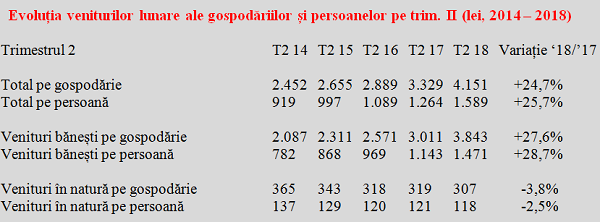
They were RON 4,151 per family and RON 1,589 per family member. It is noteworthy that money earned per person increased by almost 29% compared to the same quarter of the previous year, while in-kind incomes declined by about two and a half percentage points.
Significant warning for the sustainability of the income growth over the last four years, the comparison between the advance of a person’s earnings since 2014 (64.3% adjusted for inflation, for a fair comparison) and the 25% GDP growth (including the four percentage points of the first half of 2018) shows a major gap.
*
- Evolution of monthly incomes of households and individuals in Q2 (RON, 2014-2018)
- Q2
- Total per household
- Total per individual
- Cash income per household
- Cash income per individual
- In-kind income per household
- In-kind income per individual
*
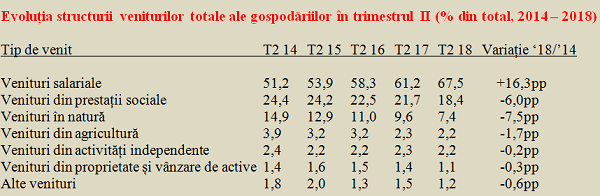
Wages significantly consolidated their preeminent position in the total income structure in a household and reached up to 67.5%. The increase in the last four years has been fulminating, with an increase of 16.3 percentage points (pp.), of which almost 40% in the last 12 months analysed by the INS.
In contrast, the share of in-kind incomes had a visible decline, considerable for the fourth consecutive year, and fell to less than half of the value registered in 2014 (7.4% in Q2 2018, compared to 14.9% in Q2 2014). Agricultural incomes also suffered a similar decrease (-44%), down from nearly four percentage points to just 2.2%.
Contrary to public rhetoric, the share of income from social benefits in the total income of a person has also diminished significantly. Out of the six percentage points lost over the last four years, more than half have „evaporated” in the past 12 months (-3.3 pp. between Q2 2017 and Q2 2018). The explanation is that this type of revenue, although on a rising trend, has evolved below the growth level of the wage income.
The evolution reflects a growing integration into the capitalist production relationships, based on the commodity production and the use of employed labour for this purpose, simultaneously with the decrease in the self-consumption share, specific to the feudal society. As well as the pressure to relieve the labour costs from social protection obligations in order to maintain competitiveness.
*
- Evolution in the structure of total households’ incomes in Q2 (% of the total, 2014-2018)
- Type of income
- Salary incomes
- Social benefits
- In-kind incomes
- Agriculture incomes
- Incomes from independent activities
- Property income and from assets sales
- Other income
*
Incomes from independent activities (-0.2pp) and incomes from property and asset sales (-0.3pp) declined in terms of their importance in the family budget but at a slightly more weighted rate, while the amounts from other expediencies reduced by one third their relative importance (from 1.8% in Q2 2014 to 1.2% in Q2 2018).
How costs have been redistributed
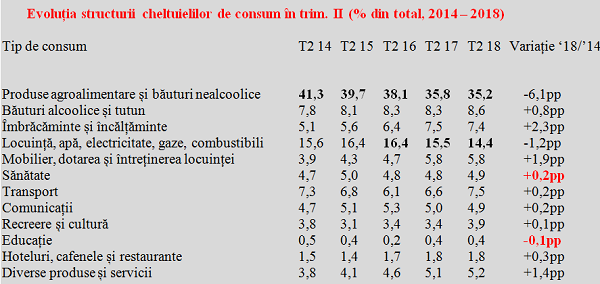
Money saved as a result of lower food prices (more than six percentage points as a share in total) were redistributed mainly to clothing and footwear (+2.3 pp.) and to furniture, endowment and home maintenance (+1.9 pp.). It is noteworthy the diversification of products and services accessed by the population (the share increased considerably in the last four years, from 3.8% to 5.2%).
This evolution reflects an increasing convergence with the Western lifestyle, as the incomes increase. Changes in the structure are a proof of an improvement in the living standards (material and quantitative, rather than spiritual and qualitative), despite the relatively frequent clichés that the current economic growth would not be felt in the population’s pocket.
It should also be noted that, in the context of robust wage increases meant to stimulate the domestic demand, the income growth has led to a significant reduction in the importance of the spending on housing, water, electricity, gas, and fuels, the second important cost group, which had reached a local maximum level in 2015-2016.
*
- Evolution in the structure of the consumption spending in Q2 (% of the total, 2014-2018)
- Type of consumption
- Agrifood products and non-alcoholic beverages
- Alcoholic beverages and tobacco
- Clothes and footwear
- Housing costs, water, electricity, gas and fuels
- Furniture, endowment and home maintenance
- Health
- Transport
- Communications
- Leisure and culture
- Education
- Hotels, coffee shops, restaurants
- Various products and services
*
Unfortunately, an aspect that needs to be analysed very seriously by decision-makers, health has moved around in circles and education has seen a decline in the share of a family budget.
That, in spite of the fact they did not hold anyway a very important spot before either. Furniture and various products and services might be modern and useful, but the reversal of the relative importance in relation to health should give food for thought.