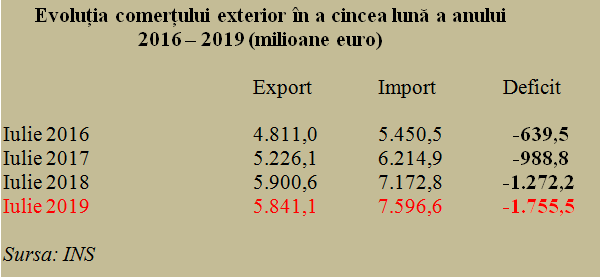
 The trade deficit in July 2019 rose sharply to the historical record of EUR 1,755.5 million, by 38% more than in the same month of last year and 55% above the level of the previous month, according to the data communicated by INS.
It should be noted that this evolution occurred in the context of a decrease by one percentage point in exports, at the same time with the increase of monthly imports by almost six percentage points.
Cumulated, for the first seven months of the year, fob exports totalled EUR 40.73 billion and CIF imports (including transport and insurance costs) EUR 50.21 billion.
Trade deficit increased to about EUR 9.5 billion, which is over 25% higher than in the first seven months of 2018 (in the context that the officially forecasted trade deficit increase for 2019 is only 11.6%).
*
Evolution of foreign trade in the fifth month of the year 2016-2019 (million euro)
Export Import Deficit
July 2016
July 2017
July 2018
July 2019
*
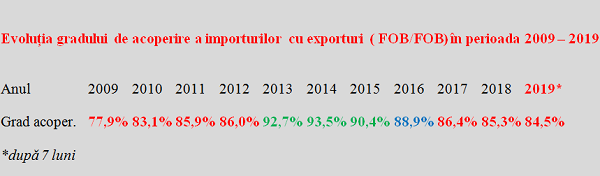
Imports coverage ratio by exports decreased to 84.5%, below the level registered last year. It is even lower than the average level registered during crisis years 2010-2012 (see table).
The gradual reorientation of the economy towards export, without amplifying in the same time the foreign deficit through the increased domestic demand, is emerging as the main way to somehow balance the national economy.
*
Evolution of imports coverage ratio by exports (FPB/FOB) during 2009-2019
Year
Coverage ratio
* after 7 months
*
The deficit recorded in the goods segment in foreign trade exchanges has already reached, after the first seven months of the year, about 4.4% of the GDP estimated for 2019.
While domestic production did not keep pace with the increase in population’s incomes, production for export lost ground for the second consecutive month, which is correlated with the weaker results in the manufacturing sector.
*
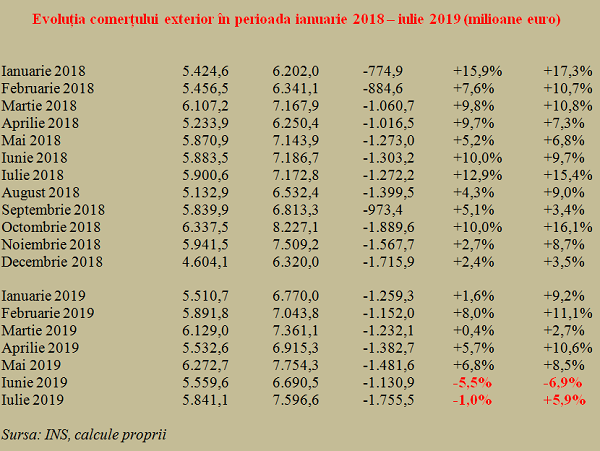
Evolution of foreign trade between January 2018- July 2019 (million euro)
January 2018
February 2018
March 2018
April 2018
May 2018
June 2018
July 2018
August 2018
September 2018
October 2018
November 2018
December 2018
January 2019
February 2019
March 2019
April 2019
May 2019
June 2019
July 2019
*
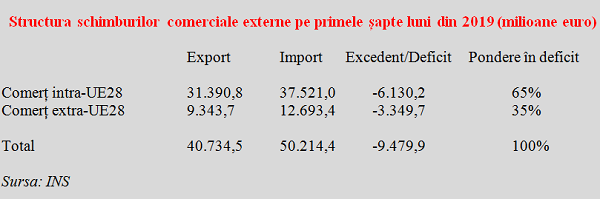
Six billion euros out of minus EUR9.5 billion – with EU countries
In the first seven months of 2019, trade exchanges with EU countries amounted to EUR 31.4 billion in exports and EUR 37.5 billion in imports (about 77% of the total in exports and 75% in imports).
On the non-EU trade segment, there have been exports of EUR 9.3 billion and imports of about EUR 12.7 billion (23% of the total in exports and 25% in imports).
Thus, there have been negative balances of around six billion euros registered in trade exchanges with EU countries and EUR 3.3 billion in the non-EU relations. It should be noted that the trade deficit share with non-euro area countries was 35% of the total, that is, above the share of about 25% that this segment has of the total foreign trade.
*
Structure of foreign trade exchanges in first seven months of 2019 (million euro)
Export Import Surplus/Deficit Share of deficit
Intra-EU28 trade
Non– EU28 trade
Total
*
We moved to the monthly deficit in transport machinery and equipment sector
The transport machinery and equipment sector (the only one we have left on a significant positive balance) declined, for the first time from one month to another, from +EUR 931 million in June to +EUR 865 million in July. In other words, the only sector that still supported the capping of the total trade deficit went „in the red” after the middle of the year.
After the increase rhythm of the surplus in the segment of transport machinery and equipment has become limited, which is why it got to cover only 12% of the foreign trade negative balance at the middle of the year compared to 17% at the end of the first quarter, now it represents only 9% in the first seven months of 2019.
*
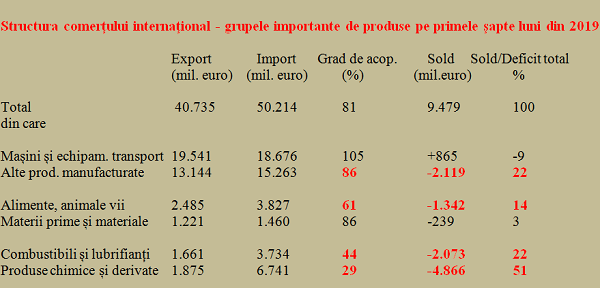
Structure of foreign trade – main groups of goods in the first seven months of 2019
Export (million euro) Import (million euro) Coverage ratio Balance (million euro) Balance/Total deficit
Total
of which
Transport machinery and equipment sector
Other manufactured goods
Food products, livestock
Raw materials
Fuels and lubricants
Chemicals and by-products
*
The deficit in the food products segment rose to EUR 1.34 billion and the sectorial coverage ratio of imports by exports went up to 60%, compared to almost 100% just five years ago. At the same time, fuels and lubricants crossed, along with the large „other manufactured goods” group, the deficit threshold of two billion euros.
Finally, the main problem facing the foreign trade, namely the chronic deficit in trade exchanges of chemicals and by-products, has deepened. The negative balance has already reached almost EUR 5 billion and accounted for 51% of the total negative result in the foreign trade exchange.