 The trade deficit in March 2018 exceeded again the threshold of EUR 1 billion after the values in the first two months were significantly lower.
However, the amount of EUR 1,056.7 million was only 1.6% higher than in the same month of the previous year, which halved the growth rate of the deficit cumulated since the beginning of the year (18% compared to 35 % at the end of February).
The good news is that monthly exports have exceeded, for the first time, EUR 6 billion.
The less good news is that imports exceeded, also for the first time, EUR 7 billion euro and the „score” of the increases was again slightly unfavourable to exports compared to the evolution of imports (9.8% versus 10.8% with the observation that the second value was applied to a bigger starting basis).
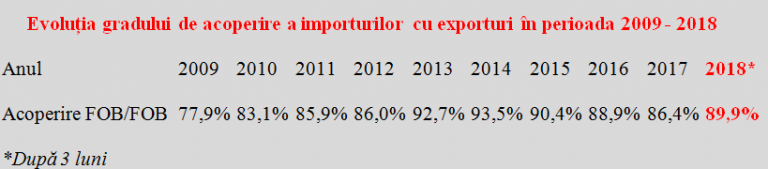
The import coverage ratio by exports was 89.9%, which was slightly better than in 2016 and 2017 but below the values recorded between 2013 and 2015 (see table). For the attempt of recovering to the level above 90% and the relatively good practices of four or five years ago to succeed, we should export a little more and/or import less in the consumer goods area.
*
- Evolution of import coverage ratio by exports between 2009 – 2018
- Year
- FOB/FOB coverage
*
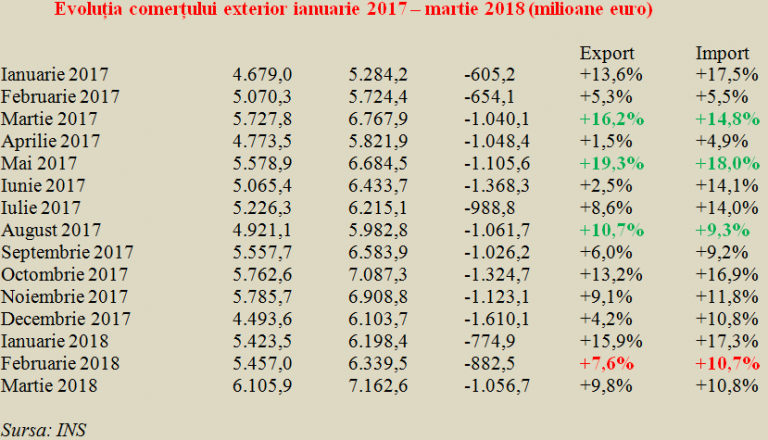
As we can see from the situation of the last 15 months, we have seen growth rates of imports of two figures or very close to 10% since May 2017 (August-September 2017), while about half of exports had growth rhythms of a single digit and half had two-digit growths.
With the note that we succeeded to have the biggest positive gap in March 2017 between the increase in exports and the increase in imports.
*
- Foreign trade between January 2017 – March 2018 (million euro)
*
Situation on intra- and extra-EU and picture by sectors
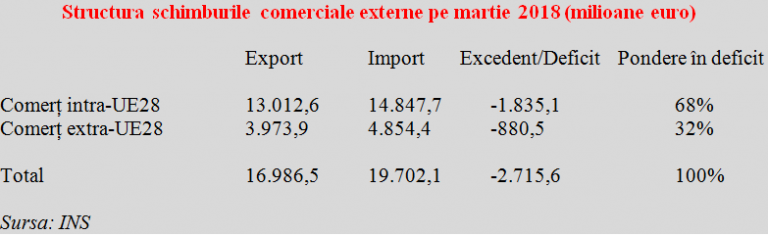
For the first three months of 2018, trade with the EU countries amounted to about EUR 13 billion in exports and EUR 14.85 billion in imports (76.6% of total exports and 75.4% of imports). In the extra-EU trade segment, exports amounted to almost EUR 4 billion and imports EUR 4.85 billion (23.4% of total exports and 24.6% of imports).
The deficit unbalance toward the trade with non-euro countries also continued after the third month of the year. Although they account for less than a quarter of Romania’s trade, they contributed 32% to the overall trade deficit in the first quarter of 2018, but the trend from one month to the next is the increase in the share of intra-EU trade deficit.
*
- Structure of foreign trade in March 2018 (million euro)
- Export Import Surplus/Deficit Share in deficit
- Intra-EU28 trade
- Extra-EU28 trade
*
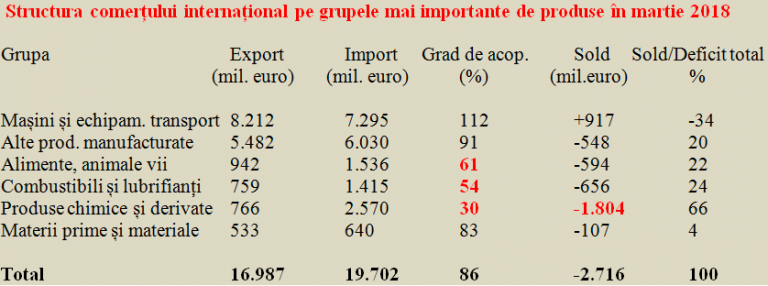
In the structure, Romania continued to obtain a positive sectoral balance in the foreign trade only on the machinery and transport equipment segment (+ EUR 917 billion).
This achievement compensated for the poor results on the segments of other manufactured products and, pay attention, on the food products sector, where the deficit went unacceptably high for our natural conditions, above the level of the manufactured products, other than machinery, and went close to the level in the category of fuels and lubricants.
Regarding the sectoral import coverage ratio by exports, the situation has worsened more and more clearly on the food products side (where it reached a worrying 61% at the end of the first quarter), and on the chemical products category where it dropped to only 30%. A minus of EUR 1.8 billion or about two-thirds of the trade deficit recorded in the first quarter of 2018 came from the trade of chemicals and derivatives.
*
- Foreign trade structure by main product categories in March 2018
- Category Export Import Coverage ratio Balance Balance/Total deficit
- Machinery and transport equipment
- Other manufactured products
- Food products, livestock
- Fuels and lubricants
- Chemicals and derivatives
- Raw materials
*
The decline in the foreign trade of raw materials was relatively moderate, just surpassing EUR 100 million.
Moreover, it is neither desirable to export no added value or very low added value products but to process raw materials to create jobs and added value here.
Altogether, the simplified image of foreign trade results shows negative results somehow of the same value on manufactured products, food products and fuels, which, together, almost equal the „gap” in the chemical products category, while the plus in the automotive sector is about half the minus in the chemical sector that strongly worsens the overall result.