 After analysing the signal data, the National Statistics Institute confirmed on Tuesday the economic growth of 5% in the first half of this year, as compared to the same period of the previous year (seasonally adjusted value for comparability and communicated to Eurostat).
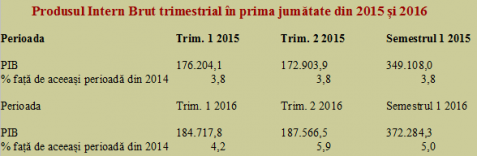
The percent change for Q2 as compared to the same period of the previous year has also been maintained at + 6.0% (unadjusted series) and + 5.9% (seasonally adjusted).
In absolute figures, the GDP has increased from about 349 billion lei in the first half of 2015 to about 372 billion lei in the first half of 2016. Check out the chart below to see the comparative data of the Romanian economy for the last two years, based on the latest official data:
Price increase in almost all sectors, hidden by decreased taxation
The data display a disturbing component of artificial GDP growth beyond the pace which can be sustainable for the macroeconomic balance, generated by the excessive consumption’s increase boosted by the tax decrease (the cut of almost 6 billion lei in net taxes, against a new set of commitments made by the state resembles of a seppuku made with a wooden sword).
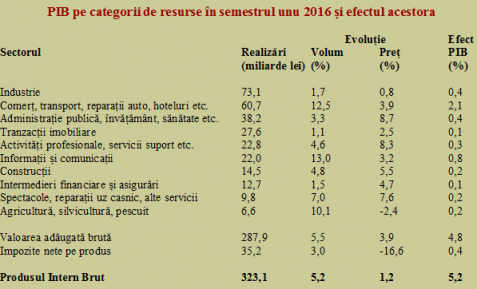
The wage increases in the public sector contributed almost nine billion lei to the nominal GDP (from 29.4 billion lei to 38.2 billion lei, i.e. almost 30%!), but they simultaneously led to a reduction of real GDP through the highest price index, i.e. + 8.7% as compared to an average of + 1.2%.
Quantitatively, the statistical effect of this „doping of the economy with budget hormones” was identical to the one obtained for the industry, i.e. + 0.4%.
Significance in terms of quality of growth is different.
Given that the whole picture also comprises the price increases across all sectors, except for agriculture, which has the lowest contribution to GDP, we find the explanation for the average percentage of 1.2% that was the GDP deflator (it implicitly amplified the final evolution of the current prices by adjusting them by only slightly more than one percent). The explanation stays only in the strong decrease of the price index in terms of taxation (-16.6%, which is the percentage that contributed in proportion to the share of these taxes in overall net gain in real GDP).
Large increase in consumption, decline in exports
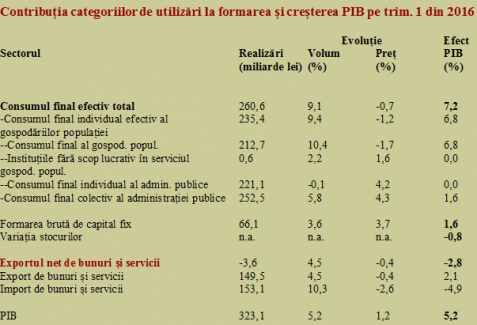
GDP by categories of resources in the first semester 2016 and their effect :
With regard to the GDP composition, we can easily notice the increase in household consumption data over the potential created by the economic growth and well above the solid base of reference given by the industrial activities segment (6.8%, over 5.2% and well above 1.7%).
The outcome was the quite strong negative effect from the foreign trade, which influenced the final result by almost minus three percent, even after they consumed in domestic stocks previously formed.
Altogether, the INS data confirms the good quantitative evolution with poor quality growth of the economy. The unsustainable growth for the current model, but irresponsibly replicated during the electoral campaigns for reasons of expediency.
We shall have to see how we further proceed – we strive to improve quality (read the budgetary balances and external deficits) through productivity and / or increased taxes or reduce the speed to avoid the stalling of the domestic demand engine.