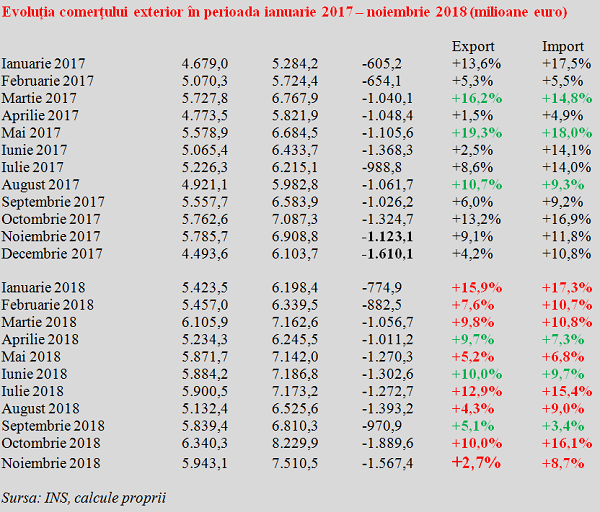
The trade deficit on November 2018 was EUR 1.567 billion, the second worst monthly performance registered last year.
Worryingly, the growth rate of exports compared to the same month of 2017 fell to only 2.7%, the lowest value in 2018 and well below the 11-month cumulated level, which was 8.6%.
The import growth rate clearly exceeded imports (+ 8.7% in November, much closer to the 11-month cumulated value of + 10.1%).
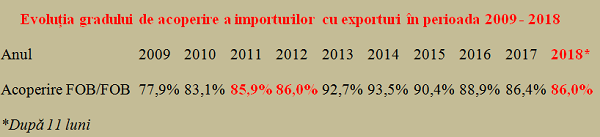
The import coverage ratio by exports continued to decline and reached 86.0%, below the level of 2017 and at the level of 2011-2012.
*
- Evolution of import coverage ratio by exports between 2009-2018
- Year
- FOB/FOB coverage
- After 11 months
*
The reason for this development is the unfortunate combination of excessive income growth and the lack of competitiveness of domestic production, which failed to keep up with the quantitative and qualitative increase in demand (see GDP results, below forecasts). Before processing the data for the last month of 2018, we reached a value of minus EUR 13,412.5 million from international goods exchanges.
In a simplified way put, by the end of November, Romania has shipped goods abroad of just over EUR 63 billion, while the inflows went up to EUR 76.5 billion. The resulting deficit reached about 6.5% of the GDP estimated for the current year according to the official forecast (about EUR 203 billion).
As we can see from the situation on the last 23 months, in November 2018 we managed to moderate the trend in the increasing monthly deficit to the EUR 2 billion euro. But the history of last year, when the deficit in December was far (+ 43%) above the one in November, suggests that this threshold could be exceeded in the last month of the year.
*
- Evolution of foreign trade between January 2017 – November 2018 (millions euro)
*
In this context, we can see a certain asymmetry between the increases and decreases in various months on the export side compared to the import side.
When we manage to increase exports, imports maintain close, when exports are declining, imports are not decreasing. That is why it would be essential that the appetite for imports that are not needed for obtaining exports should diminish.
About ten percentage points of deficit, covered by automotive industry – otherwise, major minuses
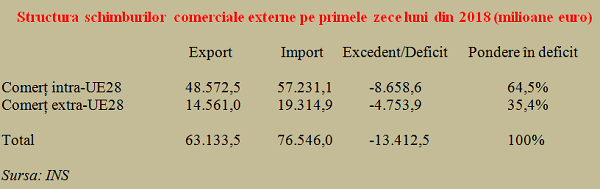
For the first eleven months of 2018, trade with EU countries accounted for EUR 48.6 billion in exports and EUR 57.2 billion in imports (76.9% of total exports and 74.8% of imports).
In the non-EU trade segment, exports amounted to EUR 14.6 billion and imports to EUR 19.3 billion (23.1% of total exports and 25.2% of imports).
This resulted in negative balances of EUR 8.66 billion in the trade exchanges with the EU countries and EUR 4.75 billion on the extra-community relations side.
To keep in mind, the deficit share represented by non-euro countries continued to grow and exceeded the threshold of 35% of the total, after we had, just four years ago, even a small surplus in the relationship with them.
*
- Structure of foreign trade exchanges in the first ten months of 2018 (millions euro)
- Export Import Surplus/Deficit Share of deficit
- Intra-EU28 trade
- Extra-EU28 trade
*
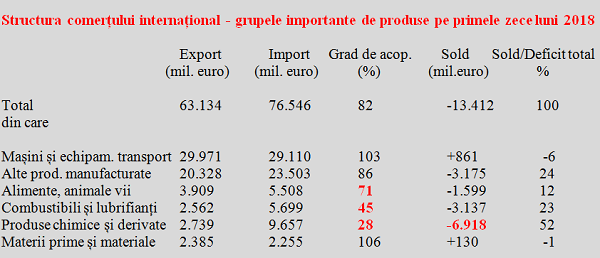
The traditional positive balance in the machinery and transport equipment sector (the only significant one that we have) continued to “melt”, reached only EUR 861 million and managed to cover only six percentage points of the overall minus recorded in the international goods exchanges.
Moreover, it is visibly moving towards only half compared to the unacceptable (given Romania’s soil and climatic conditions and resources) negative balance on the food products segment. Not to mention the systematic advance of the deficit on the manufactured goods, other than those of the automotive industry, which already went above the threshold of EUR 3 billion.
*
- Structure of international trade – important product groups in first ten months of 2018
- Export (mln euro) Import (mln euro) Coverage ratio Balance (mln euro) Balance/total deficit
- Total
- Of which
- Machinery and transport equipment
- Other manufactured goods
- Food products, livestock
- Fuels and lubricants
- Chemicals and derived products
- Raw materials and
*
But the real problem, which is very difficult to solve or compensate in the medium and long term, is the one from the petro chemistry which generates a total of 73% of the trade deficit, or about ten billion euros.
Structured between about seven billion euros in chemicals (sector coverage ratio of only 28%!!) and some more than three billion euros in fuels and lubricants (again, a very low coverage ratio of 45%, a sector from where we were easily covering our internal needs).