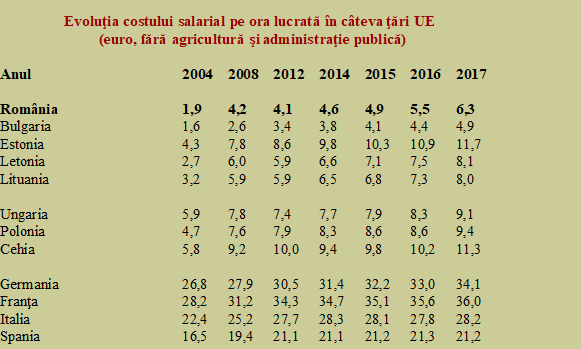
 Romania ranked first in the EU in 2017 by the labour cost increase, according to data published by Eurostat. With an increase of +15% in euro (+ 17.1% in the national currency) our country has far outpaced Bulgaria (+12%), the Czech Republic (+11.3%), Hungary (+10%) and Baltic countries (Lithuania + 9.0%, Estonia +7.4% and Latvia +7.0%)
It is noteworthy that data have been processed at the country level for the entire economy, less the agricultural sector and public administration, in the enterprises with at least ten employees.
Unlike us, the Czech Republic and Hungary recorded slightly lower increases in the national currency than in euro (8.4% and 9.2%, respectively), as their currencies appreciated against the single currency.
Salary cost in Romania has increased 3.3 times compared to 2004 and has advanced by 50% compared to 2008. However, we remain on the second to last position in the EU by this indicator, by approximately 30% above Bulgaria and 30% below Hungary, our geographic neighbours. The evolution (attention, without the public administration) is comparable to the group of BELL countries mentioned in the table below us.
*
- Evolution of salary cost per working hour in some EU countries
- (euro, without agriculture and public administration)
- Year
*
The problem is that we are not part of the small countries that have adopted or have their currency indexed to euro, but we should be closer to the mid-sized economies with floating exchange rate regimes, such as Hungary, Poland and the Czech Republic. These countries are a few years ahead of us in terms of the economic development.
Cost distribution by economic sectors: Attention to who bears the burden!
Moreover, we are differentiating ourselves from these countries, as well as from the Western practice, not only by the sharper increase in salary costs but also by the distribution of the salary costs by sectors of activity.
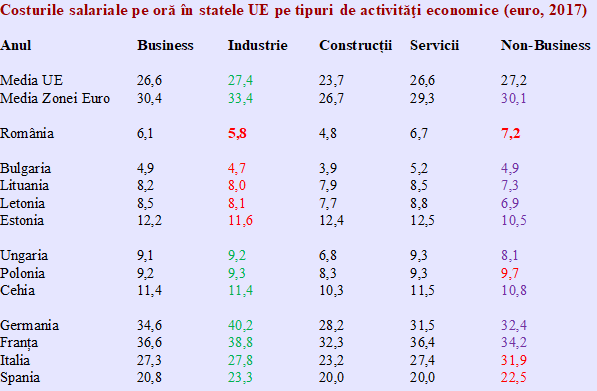
In our country, the industry registers a level of 95% of the national average, while the values match, at least, in the Czech Republic (100%), Poland and Hungary (101% each).
In Germany (116% ratio between industry and national average), Spain (112%), Ireland (110%), the Netherlands (109%) or France (106%), this positioning essential for the labour market is even clearer. Of course, we also have countries that are pretty much like us (Bulgaria, 96%), Croatia (92%) or even significantly below, like Portugal (87%), but they cannot be examples to follow.
At the same time, we have salary costs higher than the average on the services segment, which is not a European practice, and the non-business area is 18% above the national average, compared to only 2% at the EU average and minus 1% in the Eurozone.
Which tells us that we are atypical in terms of salary cost distribution
*
- Salary costs per hour in EU countries by economic activities (euro, 2017)
- Year Business Industry Construction Service Non-business
- EU average
- Eurozone average
*
If we highlight the desirable situations in green for the manufacturing industry, in purple for the non-business sector, in relation to the European practice that is successful for the development of these economies, and if we highlight in red the situations that appear to be abnormal in this context, we can easily see what we should be aware of and where we should intervene on to salary costs.
For example, we can see in the case of BELL group, which does not pay more attention to the payment in the manufacturing industry, but at least it does not exaggerate in the non-business area (which, attention, does not include the public administration in the Eurostat report).
An area where the countries that tend to pay better are Poland, the economy that is closest to us in terms of structure and level of development, as well as Latin countries Italy and Spain.


