The structure of Romania’s economy has a number of peculiarities compared to the European average in terms of the contribution brought by major sectors to the formation of gross value added (GVA). On the one hand, industry and agriculture play a more important role than in other states. On the other hand, IT is gaining ground at a faster pace than in the EU.
When looking at the evolution over the last decade, policies focused on consumption have their say, as the retail currently holds a much more significant position in the Romanian economy, according to cursdeguvernare.ro calculations based on Eurostat data.
Starting point:
Gross Value Added (GVA) is an important component of GDP and is measured as the difference between the value of goods and services produced and the intermediate consumption, thus representing the newly created value within the production process. GDP is calculated as the sum of the GVA and net taxes on the product, where the latter represent the difference between taxes collected and subsidies granted by the state. On average, GVA represents between 80 and 90% of GDP.
*
In Romania’s case, at the level of 2019 (considered a “normal” year – before the pandemic outbreak), industry and agriculture had shares of 23.4%, respectively 4.6% in the formation of GVA – namely by 3.7 percentage points, respectively 2.8 percentage points above the European average.
It should be mentioned – the “modern” economies have a higher share of services to the detriment of the industry, a notable European exception to this rule being Germany, the largest Eurozone economy with an industry share of 24.3% share in GVA.
On the other hand, regarding financial services, professional, scientific and technical services or public administration, their contribution to the formation of Romania’s GVA was significantly lower than the European average. Financial and insurance services had a contribution of only 2.6%, compared to the European average of 4.5%. Real estate services, although contributing 8.6% to GVA, were 2.3 percentage points below the EU average.

*
- Structure of European economies, by sectors (% of GVA)
- Agriculture
- Industry
- Constructions
- Trade, transport, accommodation and catering sector
- IT
- Financial services
- Real estate
- Professional, scientific and technical services
- Public administration and defence, education, public health and social assistance
- Source: Eurostat, cursdeguvernare.ro calculations
*
Firm structure change – GVA contributors ranking
The IT sector also stands out, where the contribution to the formation of GVA was at the level of 2019 with 1.4 percentage points above the EU average, respectively 6.4% or EUR 13 billion.
In fact, Romania honourably ranks eighth in Europe among countries with the largest shares of the IT sector in the formation of GVA. The incontestable leader of this ranking is Ireland (with 14.9%), while countries such as Greece, Portugal and Italy are at the bottom, with shares twice lower than Romania.
Also, constructions ranked above the European average in terms of the share in GVA, with a contribution of 6.7%, compared to the EU average of 5.5%. With 0.9 percentage points above the EU average, trade, transport, accommodation and catering sectors have seen a strong evolution over the last decade, as we can see below.
By industry size, Romania ranked eighth in 2019 at the European level, after Ireland (a small economy), the Czech Republic, Slovenia, Poland, Slovakia, Germany and Hungary. At the opposite end, excluding countries such as Luxembourg, Cyprus and Malta, were Greece, France, Latvia and the Netherlands, with industry shares below 15%. In fact, Greece and France are countries where services, including tourism, are highly developed.

*
- Structure of economies in the region compared to the EU average (share of total GVA)
- Agriculture
- Industry
- Constructions
- Trade, transport, accommodation and catering sector
- IT
- Financial services
- Real estate
- Professional, scientific and technical services
- Public administration and defence, education, public health and social assistance
*
Public administration, defence, education, public health and social assistance contributed 15.6% to Romania’s GVA formation in 2019, by 3.1 percentage points less than the European average.
This indicator (calculated indirectly based on work remuneration) has, for example, a contribution of over 20% in European countries known for the scale of public services provided, such as the Nordic countries (Finland, Sweden, Norway, the Netherlands) or France and Belgium.
When looking at the way the share contributed by main branches to the gross value added has evolved, in Romania’s case changes are spectacular, and they are mainly fuelled by public policies for stimulating growth based on consumption, which is specific to governments after 2011.
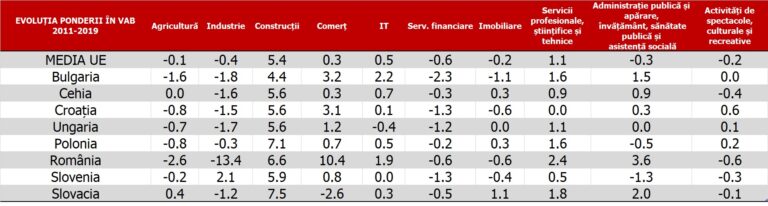
In the period 2011-2019, the industry share of GVA decreased by 13.4 percentage points, and trade was the sector that took its place. In 2019 the trade share was over 10 percentage points higher than a decade ago.
*
- Evolution of GVA share Agriculture Industry Trade IT Financial services Real estate Professional, scientific and technical services Public administration and defence, education, public health and social assistance Shows, cultural and recreation activities
- Source: Eurostat, cursdeguvernare.ro calculations
*
Constructions also registered a spectacular surge, with the share of GVA by 6.6 percentage points above 2011. This trend can also be noticed at the European level, where constructions increased their share, on average, by 5.4 percentage points during this period.
Also in 2011-2019, agriculture lost 2.6 pp. in the GVA formation, and IT gained almost two points, four times more than the European average.
Wage increases in the public sector are also indirectly visible in the evolution of the public administration’s contribution to GVA. Although it is still below the European average, in 2011-2019 it increased by 3.6 percentage points, while in the EU average, the share decreased by 0.3 percentage points.