 INS recalculated GDP in the third quarter and the first three quarters of the year.
Here are the growth data for the Romanian economy, updated in the provisional version 2, with the observation that the initially communicated growth rate has not changed but marginally (from 4.3% to 4.4% in gross series and from 4.1% to 4.2%, seasonally adjusted).
It is noteworthy the confirmation of the return to higher growth rates in Q2 and Q3 2018 compared to previous quarters after the slowdown recorded in Q4 2017 and Q1 2018.

*
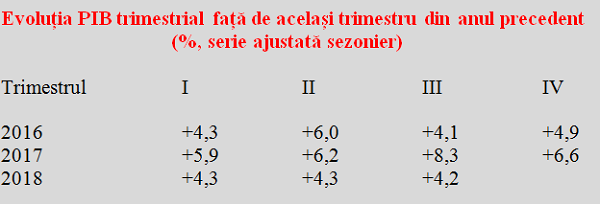
- Evolution of quarterly GDP compared to the same quarter of previous year (% seasonally adjusted series)
- Quarter
*
Rhythms moderated at the annual level precisely by the base effect of previous results (Q3 2017 marked a local maximum level of economic advance compared to the same quarter of the previous year, respectively 8.3%).
*
- GDP evolution compared to the previous quarter (% seasonally adjusted series)
*
Adjustments to the quarterly GDP recalculation were relatively minor for Q1 and Q2 (and only in the seasonally adjusted series), only for Q3 they were somewhat more consistent (+RON1,828.2 million gross series and + 1,160.3 seasonally adjusted).
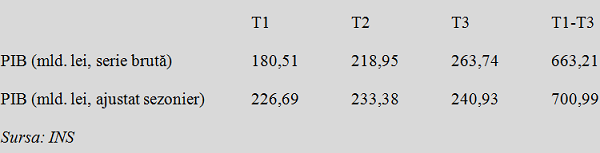
Against a target of RON 949.6 billion for the end of the year, the situation after the first three quarters is as follows:
*
- Q1 Q2 Q3 Q1-Q3
- GDP (billion RON, gross series)
- GDP (billion RON, seasonally adjusted series)
*
About RON 286 billion have remained to be realized in Q4 to reach the forecast of RON 949.6 billion (namely about 30% of the estimated value of GDP for 2018), which seems to be feasible based on the previously recorded data (GDP shares are not equal in the four quarters and a higher value is usual at the end of the year).
Constructions, the only sector that has dragged economic growth down
After the recalculation of the data in the provisional version 2 (which will remain valid until the semi-final one, which will be announced next year), the manufacturing sector remained by far the first in terms of the contribution to GDP growth, with 1.1 percentage points (pp).
It was followed by trade and agriculture, each with 0.6 pp and far away from the IT sector and professional activities plus support services, each with 0.3 percentage points (see table).
*
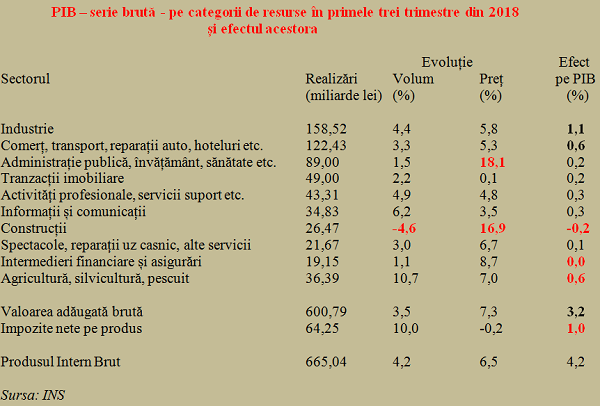
- GDP – gross series – by resource categories, in the first three quarters of 2018 and their effects
- Sector Realised (billion RON) Change Effect on GDP
- Volume Price
- Manufacturing
- Trade, transport, auto repairs, hotels, etc
- Public administration, education, health, etc
- Real estate
- Professional activities, support services, etc
- IT&C
- Construction
- Entertainment, home repairs, other services
- Financial intermediations and insurance
- Agriculture, forestry, fishery
- Gross added value
- Net tax on products
- GDP
*
The construction sector recorded a volume decline (-4.6%) and had a very high price index (+ 16.9%), a mix which led to the only negative impact on the economic growth (-0.2 percentage points).
For the financial intermediation and insurance sector, the measured contribution to the GDP growth was null.
The contribution of the public sector (public administration, education, health, etc.) was only 0.2 p, the same as the real estate transactions, mainly due to the highest maximum price index recorded in the first three quarters of 2018 (+ 18.1%),.
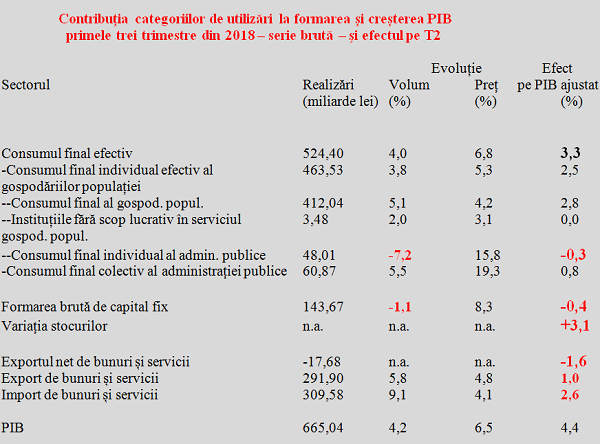
Regarding the use of GDP, we can notice how the increase in the actual final consumption of households was the main economic growth driver on Q1-Q3, with 3.3% of the 4.2% gross change registered in total.
By contrast, final individual public administration consumption (-7.2%) and gross fixed capital formation (-1.1%) declined, with negative effects on GDP of -0.3pp and -0.4 pp.
*
- Usage categories contribution to GDP formation and growth, first three quarters of 2018 – gross series- and effect on Q2
- Sector Realised (billion RON) Change Effect on adjusted GDP
- Volume Price
- Actual final consumption
- – Actual final individual consumption of households
- — Actual final consumption of households
- — non-profit making institutions in the service of households
- — final individual public administration consumption
- – collective final public administration consumption
- Gross fixed capital formation
- Stocks variation
- Net export of goods and services
- Export of goods and services
- Import of goods and services
- GDP
*
The major influence of stocks on GDP growth in the first three quarters of 2018 would deserve an in-depth explanation.
They brought 3.1pp of the adjusted growth of 4.4%. That is, they gave 70% of GDP growth, which is quite unusual to use a euphemism. And that, under the conditions of a negative net export that reduced GDP by 1.6 percentage points.
In fact, the export contribution of just 1 percentage point to the economic growth, with a 2.6% decrease in imports, explains both the decline of the real economic growth rate below the initial forecasts and the calls to curb a domestic demand that benefit to a great extent other European economies and not only.