 Romania ranked penultimate among EU member states in 2017 in terms of budget revenues share of GDP, according to Eurostat data.
With only 25.8%, our country had a share above only Ireland (23.5%), but in the context that Ireland’s GDP is expanded by statements of some multinationals that have moved their headquarters there in the anticipation of Brexit).
Bulgaria (29.5%), Lithuania (29.8%) and Latvia (31.4%) are present at a far distance above us, although also at relatively low levels compared to the European practice. For reference, we mention that neighbours France (48.4%) and Belgium (47.3%), followed by the Scandinavian group Denmark (46.5%), Sweden (44.9%) and Finland 43.4%), are at the other end.
More importantly, though, while we are pursuing a convergence process and the accession to the Eurozone, we should note that Romania was in terms of the budget revenue share of GDP at just 64% of the EU average and 62% of the Eurozone average. And our evolution compared to the previous year was the second most negative as percentage points after Hungary, while European averages registered increases, in other words, we are totally going the wrong way.
Even the Hungarians, who have lowered their budget revenues compared to the GDP from 39.3% in 2016 to 38.4% in 2017, have a percentage higher by almost 50% (!!) compared to us, which have decreased from 26.5% to just 25.8% in the same time frame.
In fact, if we relate the decline to the starting base, we have „succeeded” a more pronounced decline than theirs (2.6% vs. 2.3% of the baseline). For Hungarians, we can call it adjustment, in our case, rather recklessness, given the needs of the budget and the commitments already made to increase salaries and social benefits.
More careful with the developments in the Union and with the synchronization of budget trends, in contrast to Hungary and Romania, other states in the former eastern bloc have taken care to increase their revenue collection by more than half a point, like the case of Bulgaria, Poland and the Czech Republic. That’s also because it is the only rational way to bring the budget deficit to the recommended level of -1% of GDP. Which was reached last year as a European average and which we met in 2015 after the tax easing hit us and we headed toward -3% of GDP.
*
- Total tax revenues and total contributions (% of GDP)
- Year
- EU average
- Eurozone
- Romania
- RO/EZ
*
If we refer to the EU accession year, the crisis year 2012 (when the tax cut was claimed by the economy re-launching) and the last three years analysed by Eurostat, data show quite clearly a decrease in convergence with the Eurozone toward which we move.
Or, without proper resources, including for the implementation of projects that we need to co-finance, even though we receive EU non-reimbursable funds, we cannot build a real approximation in terms of living standards reflected in health, education or infrastructure beyond the simple statistical reference to GDP per capita.
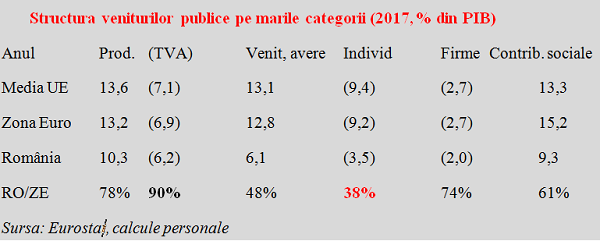
If we want to find solutions to reach a level of funding closer to the commitments made by the state, by revenue segments, the situation is as follows:
*
- Structure of public revenue by main categories (2017, % of GDP)
- Year Prod. (VAT) Revenue, wealth Individual Companies Social contributions
- EU average
- Eurozone
- Romania
- RO/EZ
- Source: Eurostat, own calculation
*
Therefore, the closest point to European practice is VAT (where we could go up to 100% if we improved the collection at least at a similar level to Bulgaria). Social contributions are below the overall average and should be increased, but it will be very difficult from a socio-political perspective to reverse the trend triggered by electoral reasons.
However, the biggest challenge will be (although it seems inevitable for taxes to increase per person and/or household, as they have reached an unacceptable level on long-term of 38% of the Eurozone average, namely half the same relative burden applied on companies, respectively 74%). Hence the average of only 48%, with which we cannot normally present ourselves at the entrance of the single currency area.
Of course, it will be argued that other newer EU members and those in the vicinity of the West have also lowered their taxes on income and wealth. Only that in their vast majority and at comparable economic dimensions, they did not make that so drastically as us (Romania reached 6.1%, compared to 7.3% in Poland, 7.4% in Hungary and 7.7% in the Czech Republic).
In addition, almost all these countries have offset by their taxes above the European average and the Eurozone on the production and VAT side (Romania 10.3%, below the EZ average of 13.2%, while Poland 14%, Bulgaria 15.1% and Hungary 18.2% in production and imports, of which Romania 6.2%, below the EZ average of 6.9% in VAT, where Hungary (9.5%), Bulgaria (9.0% ), Poland (7.8%) and the Czech Republic (7.7%) excel, not to mention Croatia (13.2%).
The idea is that some arrangements can be imagined to obtain a level of acceptance from citizens, but these adjustments cannot be made in the same direction, and especially with our amplitudes, across the entire range of budget revenues.
Sooner or later, someone will have to take their courage in both hands and explain that an average score for the admission cannot be obtained with small scores, below the European average across the board.


