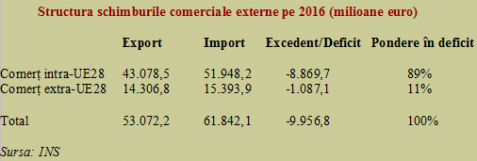
 Trade exchanges with the EU countries amounted last year to about EUR 43 billion in exports (75% of total exports) and almost EUR 52 billion in imports (77% of total imports).
In terms of non-EU trade, exports amounted to EUR 14.3 billion (25% of total exports) and imports to EUR 15.4 billion (23% of total imports).
*
- Structure of foreign trade in 2016 (million euro)
- Export Import Surplus/Deficit Share of deficit
- Intra-EU28 trade
- Extra -EU28 trade
- Source: INS
*
Practically, almost 90% of the foreign trade deficit comes from the trade relations with our EU partner countries. That makes useful an overview of imports from these countries by categories of commodities, as grouped at the international level and available for the statistics strictly kept by INS and the EU corresponding institutes.
The idea is to see whether besides the inputs let’s say „normal” for any economy, we bring perhaps in the country a proportion that is too large for our possibilities, of goods that can produce here to create jobs and GDP for ourselves, not in other countries from the single market.
We have included only the countries that have the largest share of imports on various categories, to be able to get an idea about those of them in relation to which we have low competitiveness. An improvement, to any level, could lead to balancing the foreign exchange and support the exchange rate by an increased contribution of currency.
To bear in mind! Changing the movement of a type of merchandise from entering Romania to being released on the market of the partner country would have a double effect, like in a tennis or volleyball match, where a player must win the point at stake. If she does not do that, the adversary will, as there are no draws, like in chess.
1- Food – taken from neighbours
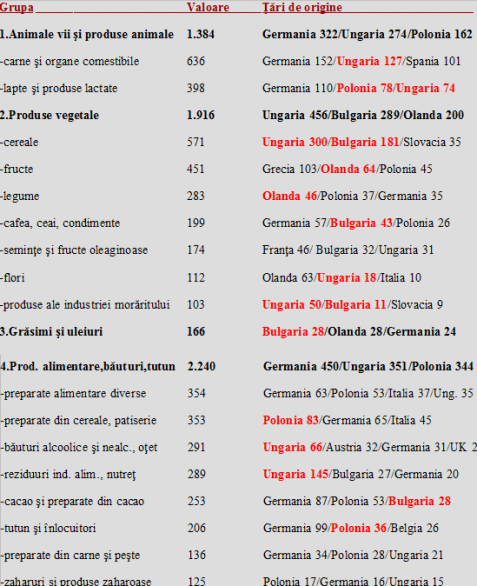
Simply put, Romania exported last year agri-food products of about five billion euros but also imported such products of about six billion euros, which resulted in a trade deficit of about one billion euros of the almost ten billion in total. We also imported meat and milk of about one billion euros, in this category where, besides the European champion of the highest exports, Germany, some countries from the Eastern bloc also are present, somehow more capable than us to develop their animal husbandry, Hungary and Poland.
We recall that before 1989, the idea of an agriculture with the plant and livestock sectors having a roughly equal share was circulating, as a feasible and at the same time attainable objective. At present, production in this field is structured with about two-thirds representing the plant sector (weather dependent) and only one-third the livestock segment. This also explains the production insufficient to cover the demand of a quite significant population, the seventh largest in Europe.
*
- Group Value Country of origin
- Live animals and animal products
- – meat and offal
- – milk and milk products
- Plant products
- – cereals
- – fruits
- – vegetables
- – coffee, tea, spices
- – oilseeds
- – flowers
- – milled products
- Fats and oils
- Food products, beverages, tobacco
- – various food products
- – bakery, pastry
- – alcoholic and non-alcoholic beverages, vinegar
- – residues of the food industry, fodder
- – cocoa and cocoa products
- – tobacco and substitutes
- – meat and fish products
- – sugar and sugar products
*
It seems that it is not justified to import, beyond the German omnipresence, meat worth EUR 127 million euro from Hungary (after, for example, Comtim has been dismantled and production moved outside the border) or milk from the same country or Poland (altogether, other EUR 152 million), because we are unable to organize our milk production and collection to make the massive shift to the UHT technology.
It would be also interestingly, let’s not say otherwise, to see why we need to import cereals worth nearly half a billion euros from our Hungarian and Bulgarian neighbours. As well as fruits and vegetables from the famous Netherlands or cocoa and cocoa products from Bulgaria.
The relatively low level of development of an industry not as light as treated like it weighs very little, the food industry, largely explains the imports of „cereal and pastry products” as well as the imports of „food industry residues”.
2- Petrochemicals, great pain of foreign trade. Where, if even Hungary and Bulgaria…
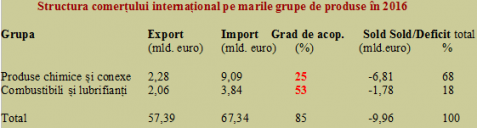
The big problem that we face in the foreign trade and the one that gives us headache in terms of sector deficit is the petrochemicals, a field that generated 86% of the trade deficit last year.
This situation would not have existed if we had not a rate of import coverage by export of only 25% for chemicals and 53% for a group of products where we would have had to be net exporters – fuels and lubricants (See table).
*
- Structure of foreign trade by main product categories in 2016
- Category Export Import Coverage rate Balance/total deficit
- Chemicals and related products
- Fuels and lubricants
*
Almost minus seven billion euros represents the bill for destroying the Romanian chemistry, transferred from the hands of the “CO2” academician to the hands of the private sector looking for immediate profit without honouring the subsequent environmental investments or as a smoke screen for strategic interests that go as far as affecting the national security.
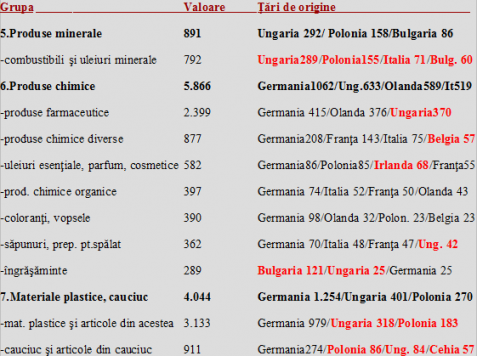
It is not accidental, yet worrying, that pharmaceutical products amounting to EUR 2.4 billion are on the list of imports in 2016, although the presence of Hungary ranking third among the countries of origin tells us that we could also develop in a different way this strategic sector for the citizens’ health.
Hungary also leads, surprisingly, in the ranking of countries from where we import fuels and mineral oils, where Bulgaria is now emerging on a disturbing fourth position.
But the biggest deficiency of the domestic market, as evidenced by the impressive value of imports, is related to the category of plastics and plastic items, with over three (three!) billion euros. A category where Hungary and Poland successfully succeed Germany in placing on the Romanian market what we are no longer able to produce. This situation is replicated for the rubber and rubber products category, where the Czech Republic also lends a helping hand to the chronic deficit of the Romanian trade.
*
- Category Value Country of origin
- Mineral products
- -fuels and minerals
- Chemicals
- – pharmaceuticals
- – various chemical products
- – essential oils, perfumery, cosmetics
- – organic chemical products
- – dyes, paints
- – soap, washing preparations
- – fertilisers
- Plastics and rubber
- – Plastics and articles thereof
- – Rubber and articles thereof
*
As, after “the Odious” (Elena Ceausescu), we have not bothered anymore with the research in the field and updating the technologies, and in the production processes we need many chemicals, we have come to even rely on larger imports from smaller countries such as Belgium, in the „miscellaneous” and „dyes and paints” categories, Ireland (!!) in the category „essential oils, perfumes and cosmetics” or the Netherlands in the category „organic chemicals„.
Let us also remember that we import even the banal soaps and washing preparations worth about EUR 20 per capita per year (EUR 362 million), with the three major powers supplying these products, but also with Hungary right after Italy and France.
And not to neglect our EU neighbours, as well as the manufacturing units which we insisted on putting to death, even though we had natural gas from domestic production, we have come to import chemical fertilizers from the „famous” Bulgarian producer, but also equally with Germany, from Hungary.
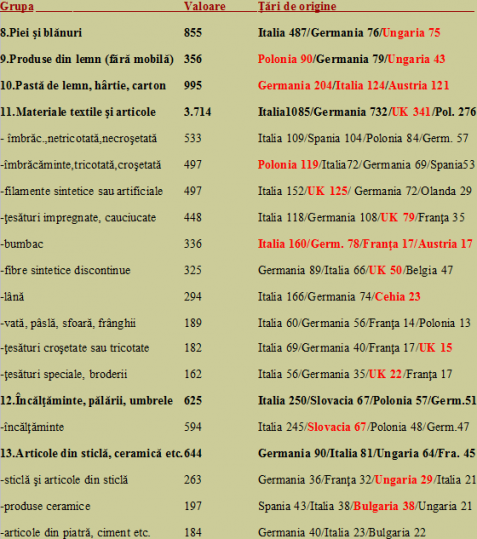
3) 200 million on cotton wool and cords … How we add some value to light industry
From the next categories, what is obvious, besides the natural imports due to the intra-industrial specialization, is the group of textiles and related products, which cumulates imports of more than EUR 3.7 billion. In fact, Romania imports some quality raw materials from other countries and adds some value locally (they do not add it there because that would mean high labour costs), which is equivalent to processing under contract, and the products are then exported, mainly to the West.
*
- Category Value Country of origin
- Leather and furskins
- Wood articles (excepting furniture)
- Pulp of wood, paper, paperboard
- Textiles and products
- – not knitted or crocheted clothing
- – knitted or crocheted clothing
- – synthetic or artificial filaments
- – impregnated, coated textile fabrics
- – cotton
- – synthetic staple fibres
- – wool
- – cotton wool, felt, twine, ropes
- – knitted or crocheted woven fabrics
- – special woven fabrics, embroidery
- Footwear, hats, umbrellas
- – footwear
- Glass products, ceramics, etc.
- – glass and glassware
- – ceramic products
- – stone products, cement, etc.
*
This explains how countries such as the United Kingdom (UK) appear in the rankings by categories of merchandise in the group of synthetic filaments, fabrics of various kinds and embroidery.
More strangely, however, is how we import large quantities of wool from Italy, Germany or the Czech Republic (!) or cotton from the same Italy and Germany, plus France and Austria (!!). Not so strange, though, as the imports worth nearly EUR 200 million of „high-tech” products such as cotton wool, felt, twine and ropes.
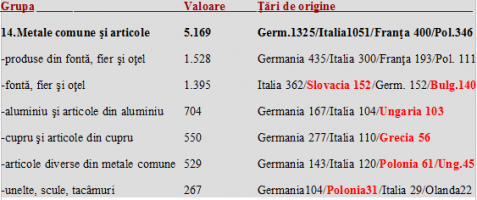
4- Metallurgy no longer saves Romania
Following the story of the scrap, we did not even have any performance in new ironmaking.
Privatizations from the metallurgical field made on an ad hoc basis, more or less related to obscure interests, have brought us into the situation of importing metals and metal products worth more than five billion euros, with a ranking that emphasizes the major European economies which are the main trade partners, Germany, Italy and France.
*
- Group Value Country of origin
- Base metals and related products
- – products of iron and steel
- – iron and steel
- – aluminium and products of aluminium
- – copper and products of copper
- – various products of base metals
- – tools, implements, cutlery
*
That should not surprise us too much if we did not see Poland’s profile right behind France. Along with which, there are flows of significant imports of iron and steel from countries such as Slovakia and Bulgaria (!), aluminium and aluminium products from Hungary and copper and copper products from Greece (!!).
5- Included in production flow of European workshops
In the only area of foreign trade where we have an important sectoral advance, the machinery, equipment and means of transportation (roughly 2016 score of about EUR 27 billion, for EUR 25.5 billion in total foreign exchanges and a corresponding surplus close to one and a half billion euros), we also have the most significant imports, of over EUR 20 billion for the two groups below.
![]()
*
- Groups Value Country of origin
- Machinery, equipment and means of transportation
- – electric machinery and equipment
- – boilers, turbines, engines, etc.
- Means of transportation
- – motor cars, tractors, other vehicles
*
Again, the lion’s share is taken by the large Western economies, which would be normal if we did not notice imports of electrical equipment from Hungary worth almost one billion euros or the inputs from other countries where cars of an important multinational company are produced, namely Spain and the Czech Republic.
The matter is not that they also have their own national brand, as we have Dacia, through the French Renault group (boasted be the decision taken in the late 1960s). The point is that we massively produce components of products that come back with other prices and added value, as imports, possibly of luxuries.
It is good that we are included in an important production chain, which brings benefits in terms of jobs and foreign trade. But it should be noticed that we are competitive mainly by a lower cost of labour (from this perspective we compare ourselves with Morocco and not the Czech Republic) and implicitly a lower cost of the subassemblies and lower prices of the motor vehicles, within their class.
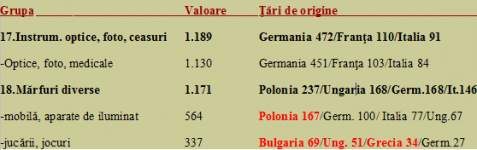
6- What we do not really know how to produce, from hi-tech to toys
Finally, we also have problems with more sophisticated technologies (almost EUR 1.2 billion imports of optical instruments and equipment, photo equipment and watches, a very competitive segment where we have not excelled even in older times). As well as furniture, where the Poles bring products somewhat better adapted in terms of quality/price ratio to our demand, which is becoming westernized but without having the corresponding money.
*
- Group Value Country of origin
- Optical instruments, photo equipment and watches
- – optical products, photo, medical equipment
- Various merchandise
- – furniture, lighting fittings
- – toys, games
*
The bottom line is that we also missed the boat for other products that may seem common, though they are not and where good money can be made by high added value. That is the category of toys, where we massively import from Bulgaria, Hungary and Greece, in the absence of our interest to develop a more consistent specialised manufacturing industry.
Yes, toys …