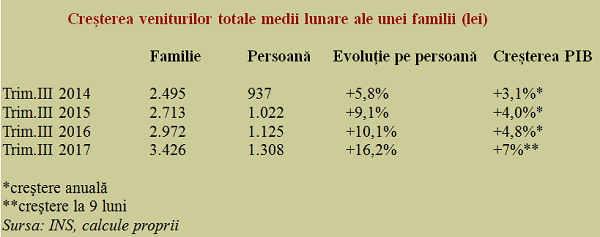
 The data published by the INS for the third quarter of 2017 show that the total average income of a household reached 3,426 lei per family and 1,308 lei per family member.
Noteworthy, a significant contribution to this value was also the reduction in the number of members per family from 2.66 people to only 2.62 people over the last four years.
After the real GDP returned to the 2008 level (occurred in 2014), the income growth accelerated from year to year to values much higher than those allowed, theoretically, by the economic growth.
The gap between the two indicators climbed from 2.7% in the third quarter of 2014 to a worrying 9.2% in the third quarter of 2017.
*
- Increase in total average monthly income of a family (lei)
- Q3 2014 family individual change per individual GDP growth
- Q3 2015
- Q3 2016
- Q3 2017
- * annual increase
- ** increase in nine months
*
Although Romania had a gap to recover, compared to the European average, in terms of the households’ share in the economic result, this evolution totally different in the personal income and GDP growth (fuelled precisely by these income increases) is not sustainable in the long run.
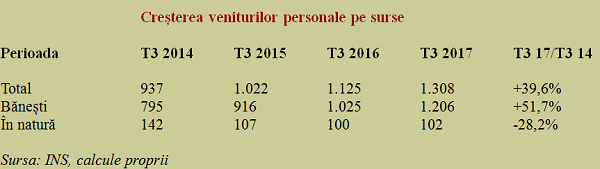
The fact that should draw the policymakers’ attention from the perspective of the income policy sustainability is the cumulative increase of almost 40% in the personal income over four years in which the GDP has increased by about 20% in total. Moreover, the 40% increase comes from combining cash increases of 52% with the decreases in kind of 28% (see table).
*
- Increase of personal income by sources
- Period Q3 2014 Q3 2015 Q3 2016 Q3 2017 Q3 2017/ Q3 2014
- Total
- Cash
- In-kind
*
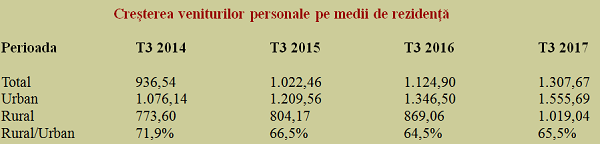
Pay attention to income gaps by residence area!
An alarm signal for deficient development policies in the territory, the increase in the personal income by residence area has been quite different over the last four years. The ratio between the income in the rural and urban areas has declined from more than 70% in 2014 to about 65% in 2017, with the remark that the stabilization from this year could be due to the movement of some high-income people outside the urban areas.
*
- Increase of personal income by residence areas
- Period Q3 2014 Q3 2015 Q3 2016 Q3 2017
- Total
- Urban
- Rural
- Rural/Urban
*
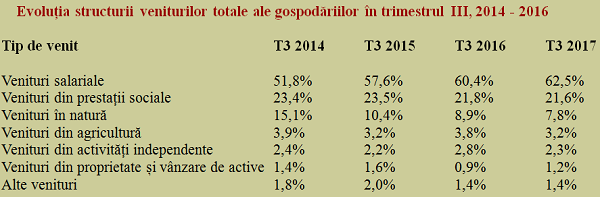
Salaries have considerably strengthened their preeminent position in the structure of the total household income, reaching 62.5%, up nearly ten percent in just four years. Instead, the share of in-kind income fell visibly and almost halved. The share of income from social benefits in the total income of a person has declined since 2015 and has reached 21.6%.
These developments reflect the increasingly high integration into the capitalist production relationships based on the commodity production and the use of the employed labour for this purpose, simultaneously with the reduction in the self-consumption share, specific to the feudal society. As well as the pressure to relieve labour costs from the social protection obligations, to maintain competitiveness.
*
- Evolution in the structure of the total salary income of households in Q3, 2014-2016
- Type of income Q32014 Q3 2015 Q3 2016 Q3 2017
- Salary income
- Income from social benefits
- In-kind income
- Incomes from agriculture
- Independent activities
- Property income and asset sales
- Other income
*
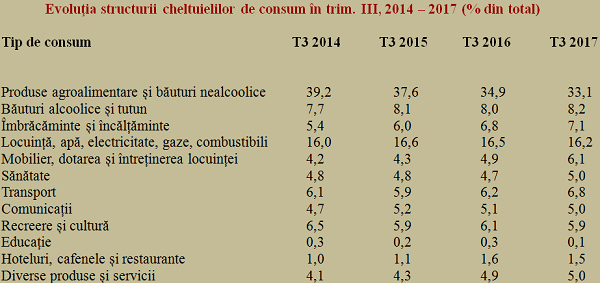
Structure of spending. Amounts allocated to food have fallen below one-third of total
For the first time, the amounts allocated to food fell below one-third of the total. Money saved following the reduction in food costs (-6.1% as a share in total) were redistributed mainly to clothing and footwear (+ 2.7%), but also to furniture, endowment and maintenance of dwelling (+1.9%), various products and services (+ 0.9%) or transport (+ 0.7%).
*
- Evolution of consumption spending structure in Q3, 2014-2016 (% of total)
- Type of consumption Q32014 Q3 2015 Q3 2016 Q3 2017
- Agri-food and non-alcoholic beverages
- Alcoholic beverages and tobacco
- House, water, electricity, gas, fuels
- Furniture, endowment and maintenance of dwelling
- Health
- Transport
- Communications
- Leisure and culture
- Education
- Hotels, cafés and restaurants
- Various products and services
*
This evolution reflects the increasing convergence with the Western way of living, as income increases, and the changes in the structure make a clear evidence of a qualitative development in the living standards.
Unfortunately, health and education have not benefited from the extra money available to families, while an increasingly larger share of this money has been spent on alcoholic beverages and tobacco.