 Last year, total investment at the national level (both from the public and private sources) in the EU member states amounted to almost EUR 3,100 billion.
Constructions accounted for about half of this amount, machinery, equipment and systems for 31% and intellectual property rights for 19%.
Noteworthy, investments in intellectual property rights, quasi-inexistent in Romania, recorded the highest growth over the last ten years, according to data published by Eurostat.
Overall, at the EU level, the investment rate has fallen from 22.4% of GDP in 2007 to only 20.1% of GDP in 2017. The decline was even more pronounced in the Eurozone (from 23.2% to 20.5% %).
The good part:
Last year, the highest investment rates (gross capital formation) have been recorded in the Czech Republic (25.2%), Sweden (24.9%) and Estonia (23.7%).
With 22.6%, and along with Finland, Romania ranks in the first third of the list (position 7-8), after Austria (23.5%), Ireland (23.4%) and Belgium (23.3%), but ahead of France (22.4%) and Hungary (21.5%).
Share of investments in GDP graph:
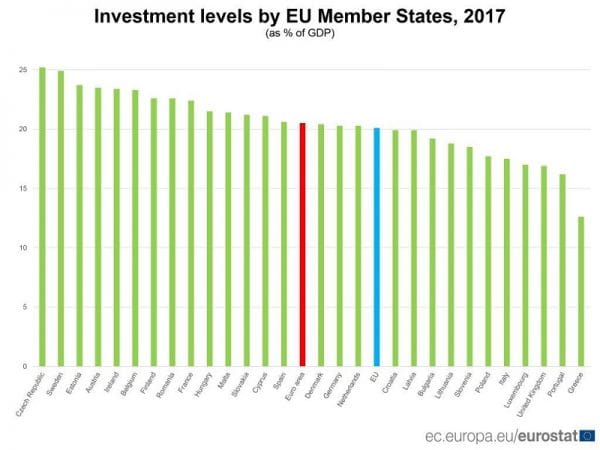 At the opposite end, there were countries like Greece (12.6%, far from the other European countries), Portugal (16.2%), the UK (16.9%), Luxembourg (17.0%), Italy (17.5%) and, very interesting, Poland (17.7%). It should also be reminded that only four countries, Sweden, Austria, Germany and, marginally, Belgium have increased their investment rate since 2007.
And the bad part …
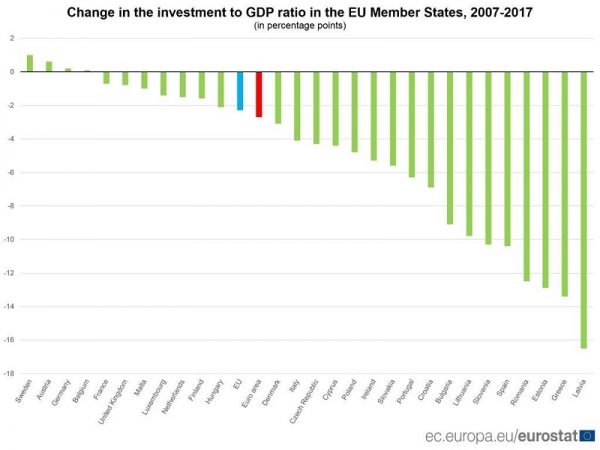
The largest declines in investments relative to GDP have occurred over the last decade in Latvia (-16.5 percentage points), Greece (-13.4 pp) and Estonia (-12.9%).
Unfortunately, Romania ranks fourth with -12.5 pp, ahead of Spain (-10.4%), Slovenia (-10.3 pp), Lithuania (-9.8 pp) and Bulgaria (- 9.1%).
Change in share of investment in GDP over the past ten years -chart
 An attenuating circumstance is, however, that the starting data were very good (in the context of occupying business positions in a new EU member country with a relatively large market).
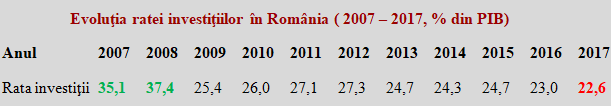
In 2007, with a 35.1% investment rate, we ranked second after Latvia (36.4%) and in 2008 we climbed to the first position, with 37.4%.
*
- Evolution of investment rates in Romania (2007-2017, % of GDP)
- Year
- Investment rate
*
Noteworthy, though, this record level coexisted with a current account deficit of about 14% of GDP. Therefore, the massive adjustment in 2009 to only 25.4%, even though GDP lost a little more than seven percent.
After GDP returned in real terms to the 2008 level (in 2014), the peak was reached in 2015 (24.7%) and afterwards (also because of the decline in public investment) went down last year to 22.6%, the lower level in the last ten years, but still significantly above the EU average.