 The Romanian economy suffers from the same vulnerabilities as those of 2008 and, in addition, the notable differences are still negative, especially at the level of the companies, according to an analysis published on Tuesday by Iancu Guda, President of the Romanian Financial-Banking Analysts Association (AFABR).
Both the similarities and especially the differences to 2008 raise doubts about the capacity with which „the business environment can better handle a possible international crisis compared to what happened in 2008″, says Iancu Guda in his analysis.
In 2016 and 2017, it is registered, the same as in 2008:
- „a record economic growth, driven by consumption (which causes the deepening of the trade deficit, amid the advance of imports, faster than exports)
- credit growth (which causes the real estate prices to rise),
- the increase in the fiscal deficit (caused by the poor tax revenue collection, which creates a low taxation of the economic growth, on the one hand, and by the wage increases and social benefits provided by the public sector, on the other hand)”, according to the analysis mentioned.
 „Significant differences” and in negative terms compared to 2008:
- The share of public debt in GDP is twice as high (although half the EU average)
- The workforce is lower
- Public investment diminished by half and
- The level of foreign investment is also lower (the decrease of the available capital and workforce capped the potential economic growth),” remarks the AFABR President.
Indeed, Romania’s public debt (calculated according to the EU methodology at the nominal value, excluding the guaranteed debt) was 285.8 billion lei (EUR 63.6 billion) at the end of last year, namely 37.7% of GDP, while in 2008 it was 13.4% (ESA methodology), according to the BNR data.
Working population was 8.449 million in 2016, of which 6.201 million employees, compared to 9.369 million working people in 2008, of which 6.317 million employed, according to the National Institute of Statistics (INS).
Public investment accounted for 4.5% of GDP in 2008, but only 2.4% in 2016, and foreign direct investment in 2016, of only EUR 4.08 billion, did not even represent 43% of the FDI in 2008.
Unfavourable macroeconomic data is even worse if we add the big differences existing at the level of companies in 2016, which „make us more vulnerable” than in 2008, says Iancu Guda.
Vulnerable companies
The microeconomic picture, as shown by the analysis of the financial statements for financial years 2016 and 2008, reveals „five major differences that make us more vulnerable” than we were 2008, according to the AFABR President:
*
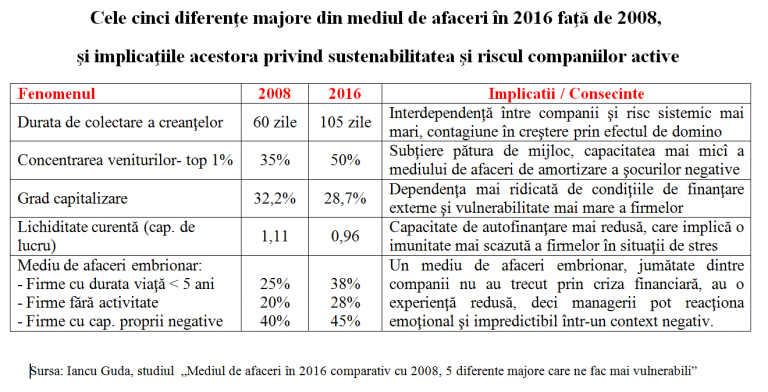
- The five major differences at the level of the business environment in 2016 compared to 2008 and their implications in terms of sustainability and risk for active companies
- Phenomena 2008 2016 Implications/Consequences
- Duration of debt collecting process 60 days 105 days higher interdependence between companies and systemic risk, increasing contagion by domino effect
- Revenues concentration – top 1% 35% 50% diminishing middle class, lower capacity of business environment to mitigate the negative shocks
- Equity ratio 32.2% 28.7% higher dependency on the external financing conditions and higher vulnerability of companies
- Current ratio (working capital) 1.11 0.96 lower self-financing capacity which means a decreased immunity of companies to stressful situations
- Business environment in an embryonic stage:
- – companies with lifetime < 5 years 25% 38% A business environment in an embryonic stage, half of the companies have not gone through the financial crisis, have a low experience which means that their managers might have emotional and unpredictable reactions in a negative context
- – companies with no activity 20% 28%
- – companies with own negative capital 40% 45%
*
- Increase in the average duration of company debt collecting process, from 60 days (2008) to 105 days (2016) – which makes the situation of some companies to dependent on the financial health of others.
„Delayed payment of an invoice due to temporary liquidity problems or the client’s insolvency will cause a negative shock twice as high to the creditor suppliers.” In other words, „a rock, thrown into the lake (a trigger for an international crisis) will generate twice as high waves,” says the AFABR President.
The sectors with the longest periods for debt collection „which will be the most affected by this phenomenon” are:
- Construction – with an increase in the debt collection period from 131 days (2008) to 220 days (2016),
- Services provided to companies (from 126 to 216 days) and
- Agriculture (from 108 to 198 days);
- „The thinning of the middle class and a higher concentration of revenues, profits and liquidity to top companies„. The revenue share of the top 1,000 largest companies in the total of companies increased from 35% in 2008 to 50% in 2016.
Only 1% of the active companies held 58% of the total liquidity of all companies (cash in the cash register and bank accounts) in 2016, compared to 43% in 2008, according to the analysis.
Also, „profits obtained by the business community are more concentrated than ever” by large firms: the largest 1% of companies hold 46% of the total profits earned in 2016, compared to 35% in 2008.
On the contrary and „not by accident, losses are more widespread (their concentration is lower), with the first 1% of companies registering only 26% of the total losses reported by the entire business environment”;
- Very low equity ratio with the trend being steadily decreasing since the impact of the financial crisis to date, namely from 32.2% in 2008 to 28.7% at the end of 2016.
*
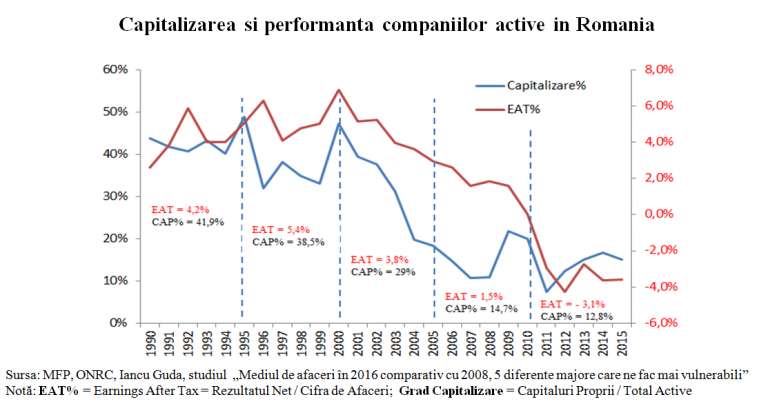
- Equity ratio and performance of the active companies in Romania
*
„A decrease in equity ratio implies an increase in the debt ratio, therefore, a higher vulnerability of firms to external financing and the conditions attached to it,” recalls Iancu Guda.
The only sectors with an equity ratio of over 40% at the end of 2016 are:
- Production and supply of electricity and heat, water and gas (43%)
- Financial intermediation (43%) and
- IT (42%)
Sectors with an equity ratio below 15% are:
- Recreational, cultural and sports activities (9%)
- Construction (10%) and
- Health and social assistance (15%)

*
- Equity ratio and performance of companies by the period of establishment
- Year of establishment Number No % Total assets (million lei) Assets % Own capital Capital % Level of equity ratio EAT (%)
*
„This phenomenon has been especially amplified in 2016, when profits have been capitalised in dividends of 43 billion lei, representing 85% of the profits obtained in that year, almost all dividends distributed in 2009-2015 and respectively, 10% of the equity of all companies,” remarks the AFABR President in his analysis.
The analyst has not identified „but a single decisive factor driving such a behaviour of accelerated distribution of dividends to shareholders: the dividend tax reduction from 16% to 5% as of January 1, 2016”.
Moreover, „another practice is becoming more common: funding from the affiliated entities.
The share of loans contracted from group companies/shareholders in total debt increased from 11% (2008) to 20% (2016). These amounts can be more quickly withdrawn by shareholders (compared to the situation in which they were injected through the share capital) and are probably secured by fixed assets important/essential to the core business. This also means a more important role of the creditor shareholders at the creditor table, in a possible insolvency of the respective firm,” said the analysis quoted.
- Consolidated working capital at the level of the business environment became negative
„Positive values of the working capital indicate a good potential for self-financing of firms, while negative values point to pressures on liquidity and increasing insolvency risk,” says the analysis.
The working capital is the difference between current assets (the most liquid assets held by companies) and short-term debt (to be reimbursed within one year).
Current liquidity (ratio between current assets and short-term debt) across the business environment fell from 1.11 (2008) to 0.96 (2016) and the sectors with the lowest level of this indicator at the end of 2016 are real estate transactions (0.56), hotels and restaurants (0.72) and machinery and equipment (0.82).
- Business environment is younger and less experienced
The number of companies that became insolvent between 2008-2016 was 166,000, plus about 850,000 companies that have been deregistered, dissolved or suspended. Nearly one million companies have interrupted their activity in this period – „enormous number, as only 650,000 companies have submitted their financial statements for 2016, out of which almost a quarter do not have any activity anyway), and the average lifetime of an active company in Romania is less than 10 years.
The analysis reveals that a younger and unexperienced business environment in 2016 compared to 2008 is reflected by the following data:
- The share of companies with a lifetime less than 5 years (from the time of their establishment) in total active companies increased to 38% in 2016, from 25% in 2008. The sectors with the highest proportion are recreational, cultural and sports (54%), financial intermediation (46%) and transportation (43%). These are also the sectors where most companies have been established during the period under review because of low entry barriers
- The share of non-performing companies increased to 28% (2016), from 20% (2008) and the sectors with most companies in this situation are real estate (36%), extractive industry (35%) and construction (35%);
- The share of companies with a negative own equity increased to 45% (2016), from 40% (2008) and the sectors with the most companies in this situation are hotels and restaurants (58%), retail (57%) and food and beverage industry (53%).
The financing structure and efficiency of the active companies in Romania „seem to be strongly correlated with the experience gained over time”.
Thus, „the companies established before 2000 represent only 21% of the total active companies at the end of 2016 but generate 44% of the total assets held by local companies, 61% of the own equity, the highest equity ratio (about 40%) and the highest net profits (almost 5%)„.
In conclusion, we are dealing with a „less capitalised (more indebted), polarized, unexperienced, vulnerable business environment (with a lower self-financing capacity) and more exposed to the contagion effect (domino), to spreading the commercial risk (insolvency of clients). I do not see how such a business environment can better manage a potential international crisis compared to what happened in 2008,” Iancu Guda, President of AFABR, concludes in his analysis.