The price level in Romania stood at 52% of the EU average in 2017, according to data provided by Eurostat for 2017 on the relative cost of goods and services in the member countries.
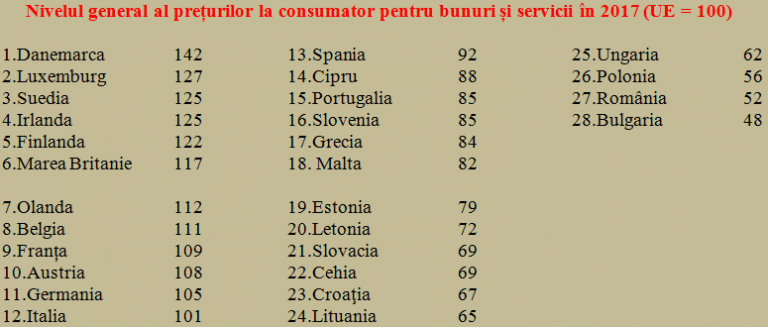
This level placed us on the penultimate position among the 28 member states, ahead of Bulgaria (48%), but behind Poland (56%).
In top three most expensive European countries we find Luxembourg (127% compared to the EU average), Ireland and Sweden (each with 125%).
They were followed by Finland (122%) and the United Kingdom (117%) and Italy was the state where the level of prices was the closest to the EU average (101%).
*
- Overall level of consumer prices for goods and services in 2017 (EU = 100)
- Denmark 13. Spain 25. Hungary
- Luxembourg 14. Cyprus 26. Poland
- Sweden 15. Portugal 27. Romania
- Ireland 16. Slovenia 28. Bulgaria
- Finland 17. Greece
- UK 18. Malta
- Netherlands 19. Estonia
- Belgium 20. Latvia
- France 21. Slovakia
- Austria 22. Czech Republic
- Germany 23. Croatia
- Italy 24. Lithuania
*
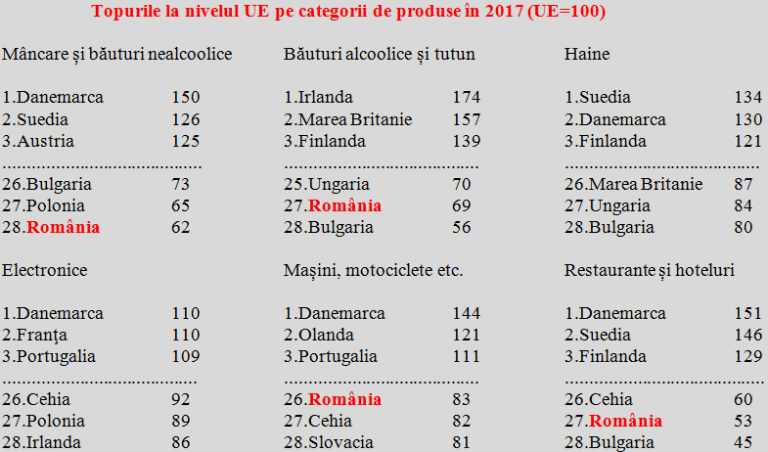
By categories, our country has the lowest prices of food and non-alcoholic beverages (exactly the category where we rank first by the share in the household consumption basket) and ranks second in the category of alcoholic beverages plus tobacco (which is not quite well from the health perspective), respectively in the category of restaurants and hotels (in both cases, after Bulgaria).
As a result of the relatively high level of car production, we also rank third among the cheapest means of transport (cars, motorcycles, etc.), at a short distance from Slovakia and the Czech Republic, two other countries with a strong industry in this field. Incidentally, we are in the opposite situation in the category of electronic products (where we have the highest relative level from all categories of goods and services, 95%, significantly over the Czech Republic – 92% or Poland – 89%).
As expected, the largest difference between countries in terms of prices by category of products and services is found in the hotels and restaurants category, where the proportion is 3.4:1 and in alcoholic beverages and tobacco category, where the ratio is 3.1:1. At the opposite end, a gap of about 30% is recorded in electronics and one of 70% in clothes category.
*
- Ranking at the EU level by categories of products in 2017 (EU =100)
- Food and non-alcoholic beverages Alcoholic beverages and tobacco
- Denmark 1. Ireland
- Sweden 2. UK
- Austria 3. Finland
- ….. …..
- Bulgaria 25. Hungary
- Poland 26. Romania
- Romania 27. Bulgaria
- Electronics Cars, motorcycles, etc.
- Denmark 1. Denmark
- France 2. Netherlands
- Portugal 3. Portugal
- ….
- Czech Republic 26. Romania
- Poland 27. Czech Republic
- Ireland 28. Slovakia
- Clothes Restaurants and hotels
- Sweden 1. Denmark
- Denmark 2. Sweden
- Finland 3. Finland
- …..
- UK 26. Czech Republic
- Hungary 27. Romania
- Bulgaria 28. Bulgaria
*
Noteworthy, the level of prices directly determines the purchasing power of the wages. Specifically, at the average salary registered last year (2,384 lei, namely 522 euro at the average exchange rate of 4,5681 lei/euro), Romanians had in 2017 a purchasing power equivalent to 1,022 euros calculated at the average prices in the EU.
Once we are advancing on the path of European convergence, it would be useful to calculate the consumer price index also based on the average consumption structure at the European level, to which we are heading.
In estimating future inflation, we shall have to take into account that part of the overall price increase will come from the Europeanization of consumer weights (less food, more money for clothes, cars, etc.) as income growth continues.