 The inequality of income distribution in Romania has diminished in the last two years, and official statistics rushed to send out the improvement in this fundamental social indicator with the values estimated for 2017 (most of EU countries are still in the stage of reporting results for 2016), so our country went down from the first position after the crisis to the 3rd.
With an improvement from the maximum level of 8.2 of the ratio between the total income share assigned to 20% of the population with the highest income and the total income share assigned to 20% of the population with the lowest income (income should be understood as available equivalent income) to 7.0, we were positioned in the Eurostat chart below Bulgaria and Lithuania.
See charts: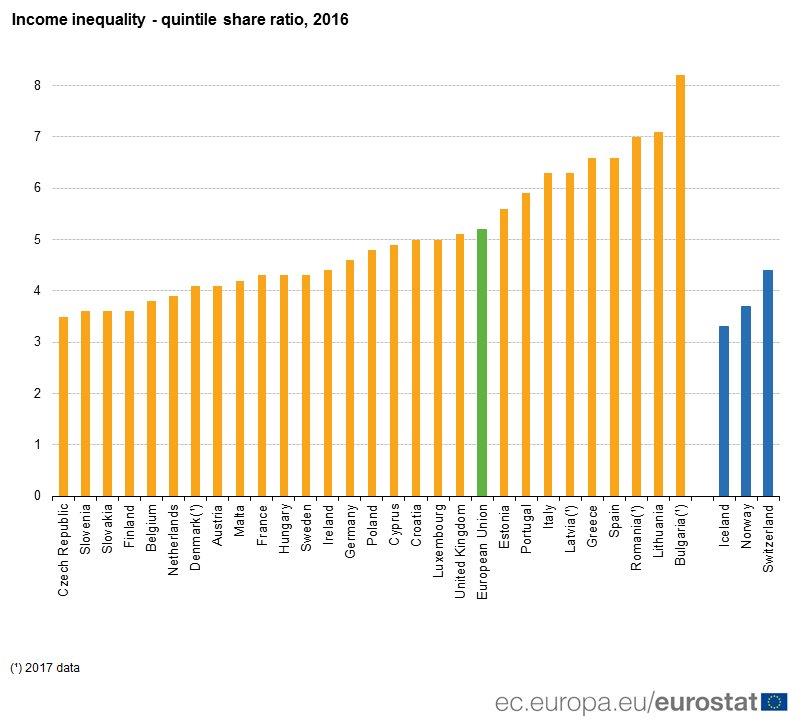
 Simply put, the richest Romanians gained last year seven times more than the poorest compatriots, which is a slight improvement compared to the year when we managed to bring GDP at the same level, in real terms, as before crisis (GDP 2014 = GDP 2008, after technical adjustments of the nominal values recorded).
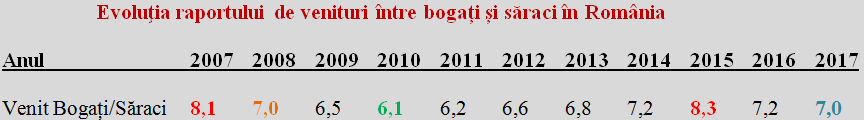
How relation between the rich and the poor evolved
To keep in mind, in the first year after the EU accession, when the European social inequality indicator was calculated according to the European methodology, to ensure comparability with other states, we reached a relatively high level. Somewhat paradoxically, the crisis led to the low conjectural value of 6.1 (anyway above the European average of 4.9 registered that year), to which the intervention of the judiciary for cancelling the adjustment of the pension point played an essential role.
*
- Evolution of income ratio between the rich and the poor in Romania
- Year
- Income rich/poor
*
Incidentally or not, after we went up with the target indicator to a local maximum level right in the year when we best managed national deficits (especially the fulfillment of the well known MTO – Medium Term Objective – along with a general consolidated budget deficit of only -0.8% of GDP, but also the current account deficit of only -1.2% of GDP, about one third compared to 2017), we reached exactly the 2008 value, namely the level before the crisis.
The good part is that we have somewhat reduced gaps between the richest and the poorest Romanians, the less good part is the way we did that. Increasing social benefits makes sense and is European in its essence, but it would have been much more useful and sustainable if going out of poverty had taken place based on productive jobs (we are still the country with the highest percentage of poor employees in the EU).
How we stand compared to other EU states
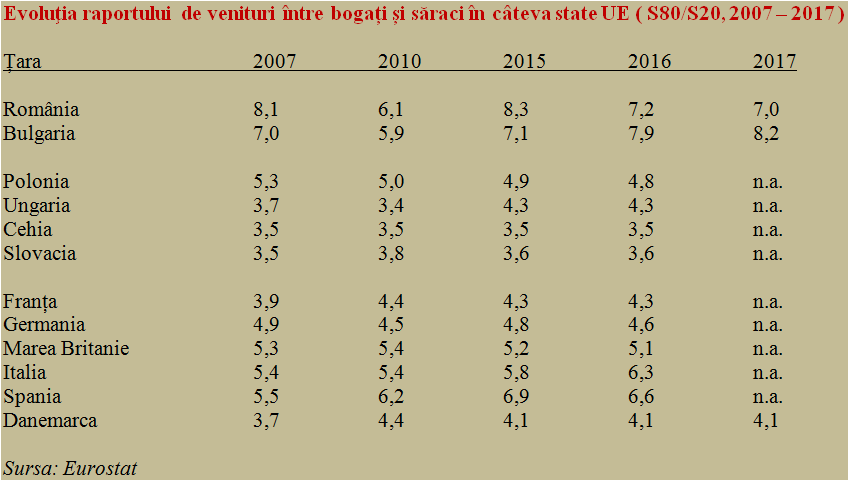
The data presented below show developments in some of the EU countries, according to Eurostat reports for 2007, 2010 and 2015-2017, so that we compare ourselves with countries in the region which are close to our development level, as well as with big Western democracies. We can see that, along with our neighbours from the south of the Danube, we are far outside the European practice.
*
- Evolution of the income ratio between the rich and the poor in some EU countries
- Country
*
It is worth noting the stability of this indicator in the Central European countries that also have been colleagues in the socialist bloc and have maintained ever since a certain approach to social relations and the distribution of wealth, closer to the European values of French or German type, even with Nordic influences in the case of the Czech Republic (the champion of European income equality) and Slovakia.
As a model, we could take again, as in other economy-related situations, Poland. A model that gradually evolved in the sense of a slightly smaller ratio between the incomes of the richest share of the population and those of the poorer share, with a convergence, quite transparent, towards the Western neighbour, Germany. Also influenced, in its turn, by France.
Unfortunately, though, by Latin similarities, we look more like Spain and Italy, countries where social inequalities are higher than in the rest of the Western world and which have seen wider changes in recent years.
It should also be underlined the Eurostat findings, which show that, compared to the reference year 2008, Latvia registered the largest decline in income inequality (from 7.3 to 6.3), which shows that things can go in the direction of reducing gaps in a steady rhythm, where there are a political will and real adherence from the population.
Interestingly, next countries in this ad hoc ranking are the UK (-0.5pp, from 5.6 to 5.1), Belgium (0.3 pp, from 4.1 to 3.8, which means that even though the situation was already good enough, they still bothered to bring the equalization of incomes) and, beware, Poland (0.3pp, from 5.1 to 4.8, but by 0.5pp compared to 2007).
On the opposite side, Bulgaria (+1.7 pp, from 6.5 in 2008 to 8.2 in 2017), Italy (+ 1.1pp, from 5.2 to 6.3), Spain (+1 pp, from 5.6 to 6.6) and Lithuania (+1 pp, from 6.1 to 7.1).
The link between the rise in inequalities and economic performance somewhat weaker than other similar states seems quite clear, which implies that the increase in social inequalities does not help the development in the medium and long term.